Copyright
©The Author(s) 2019.
World J Stem Cells. Jan 26, 2019; 11(1): 44-54
Published online Jan 26, 2019. doi: 10.4252/wjsc.v11.i1.44
Published online Jan 26, 2019. doi: 10.4252/wjsc.v11.i1.44
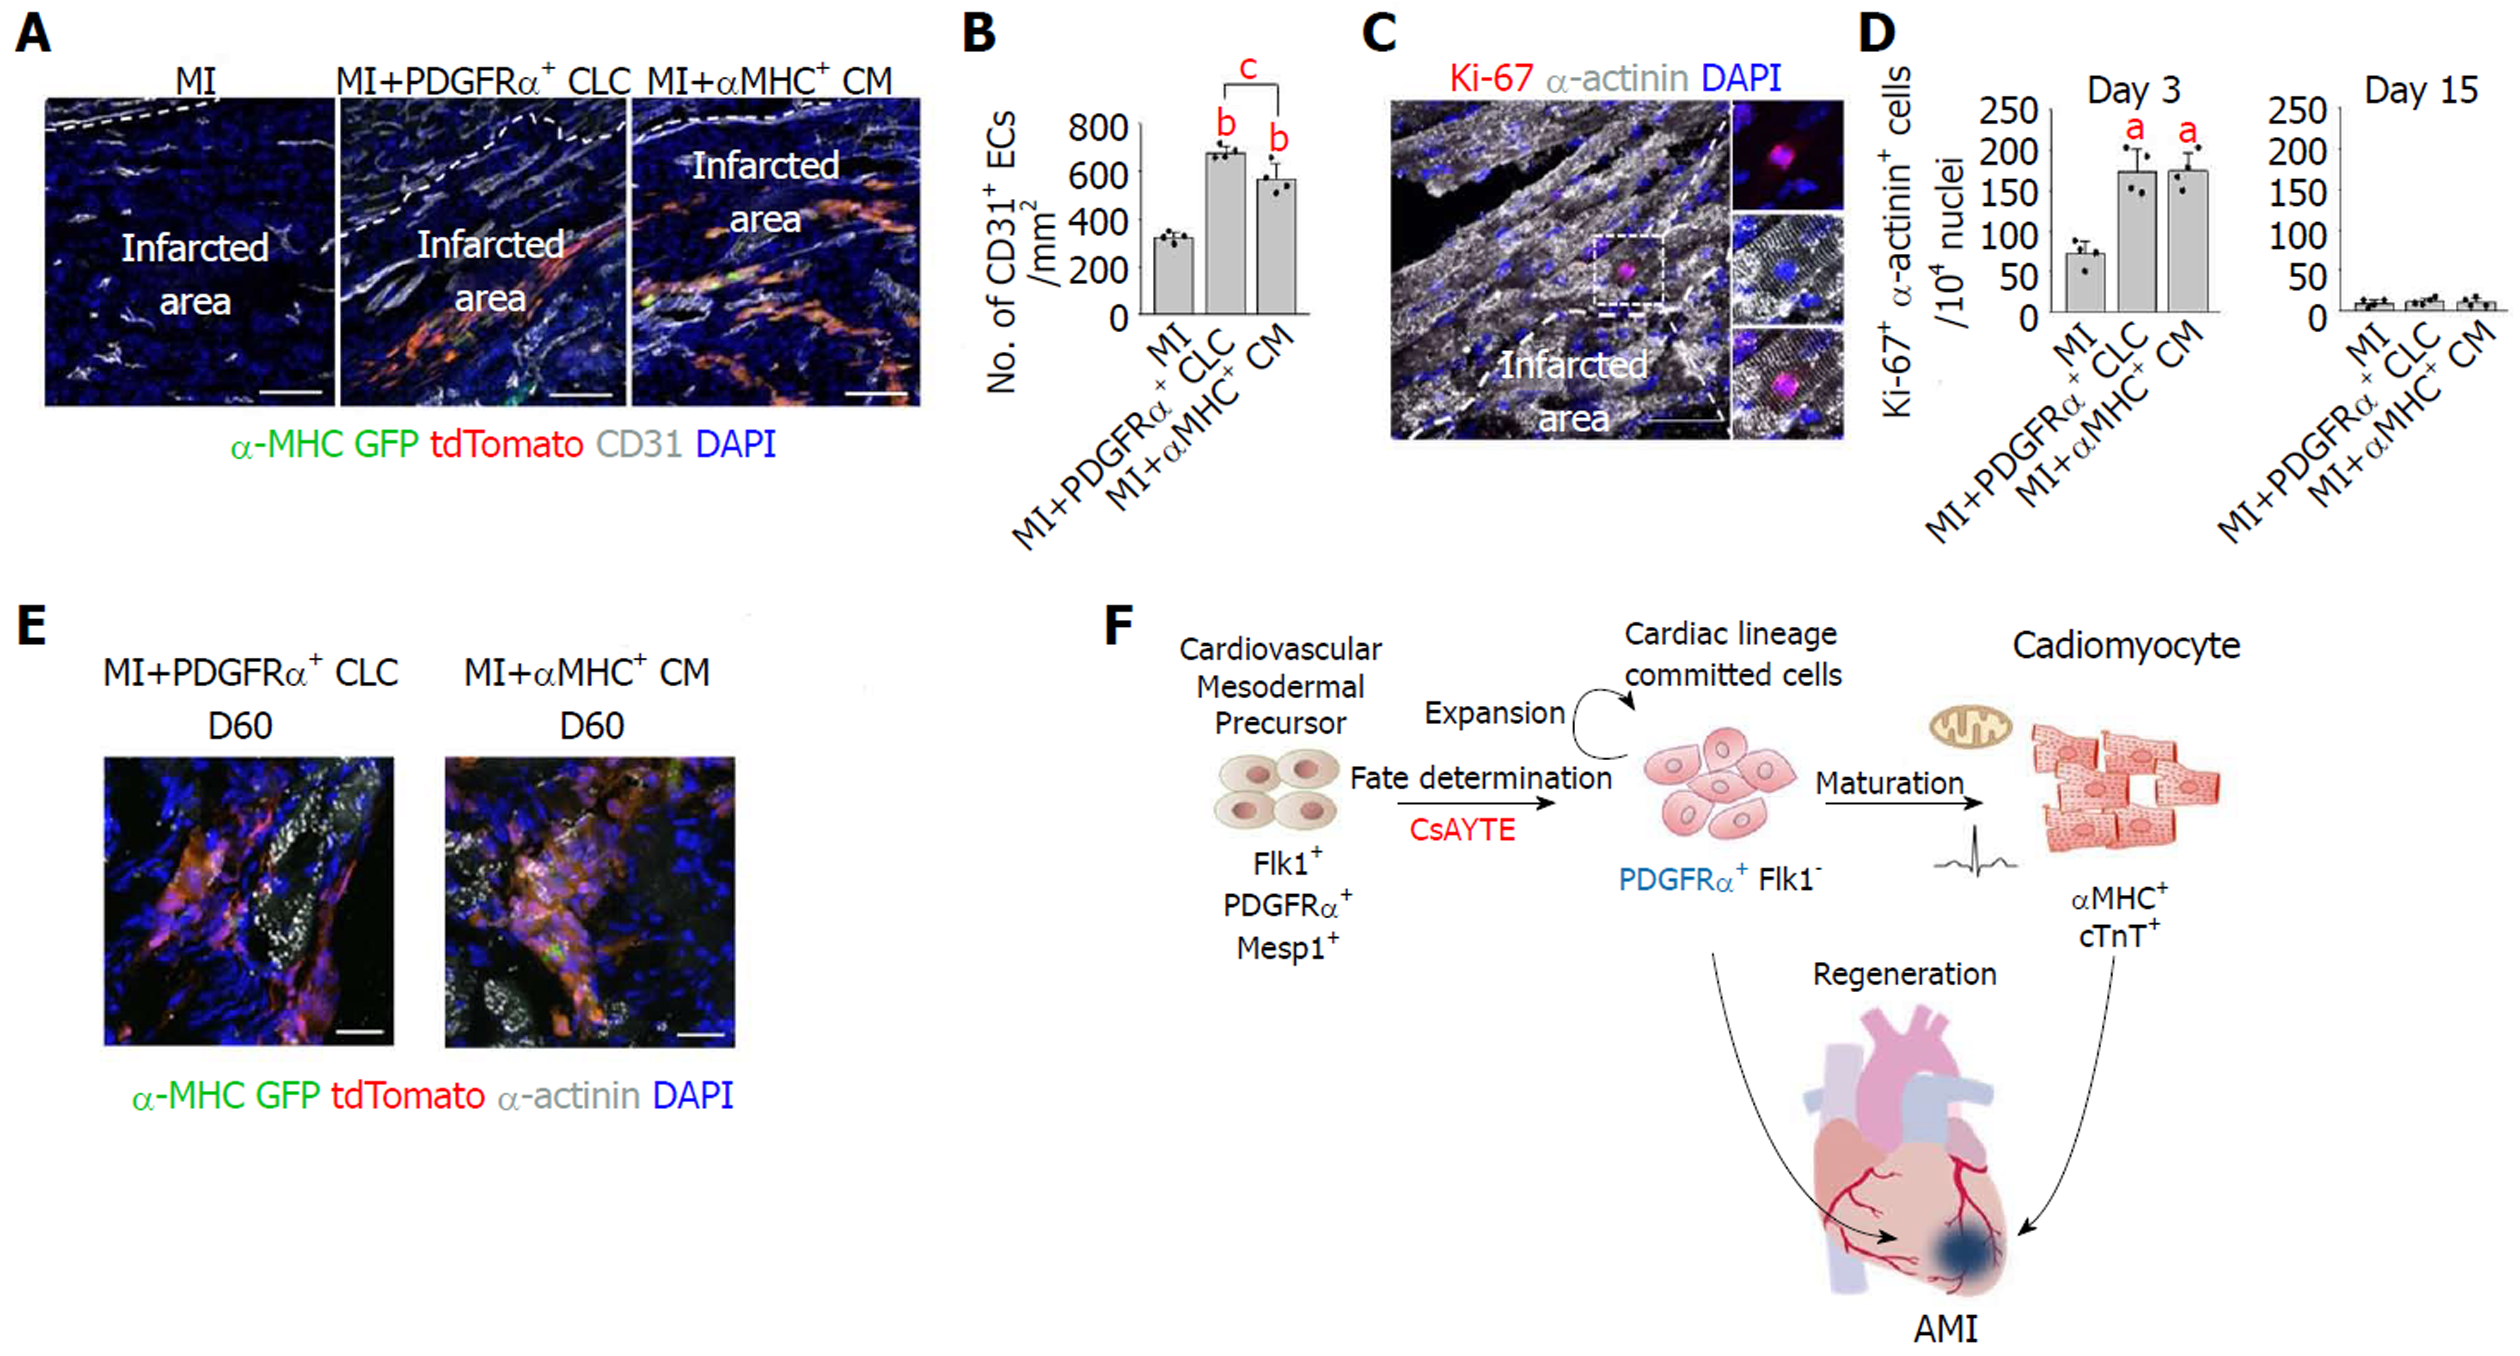
Figure 4 Proliferation and survival of implanted platelet-derived growth factor receptor-α+ cardiac lineage-committed cells in the infarcted heart.
A: Representative confocal image of Ki-67+ host cardiomyocytes in the peri-infarcted region 3 d after cell injection. Dotted-lined rectangular region is magnified in right. Scale bar, 50 μm; B: Quantifications of Ki-67+α-actinin+ cardiomyocytes per 104 nuclei in the peri-infarcted region 3 and 15 d after the implantation. Each group, n = 4. aP < 0.05 vs myocardial infarction (MI); C: Representative confocal images of revascularization within the infarcted areas 15 d after the implantation. Scale bars, 100 μm; D: Quantifications of capillary density (No. of CD31+ ECs/mm2) within the infarcted areas. Each group, n = 4. bP < 0.01 vs MI; cP < 0.01 vs MI+ platelet-derived growth factor receptor-α (PDGFRα)+ cardiac lineage-committed cells (CLCs); E: Representative confocal images of tdTomato+ PDGFRα+ CLCs and αMHC+ CMs 60 d after the implantation. Three independent experiments showed similar findings. Scale bars, 20 μm; F: Schematic diagram illustrating the regenerative potential of PDGFRα+ CLCs in the infarcted heart. CLCs: Cardiac lineage-committed cells; CMs: Cardiomyocytes; MI: Myocardial infarction.
- Citation: Hong SP, Song S, Lee S, Jo H, Kim HK, Han J, Park JH, Cho SW. Regenerative potential of mouse embryonic stem cell-derived PDGFRα+ cardiac lineage committed cells in infarcted myocardium. World J Stem Cells 2019; 11(1): 44-54
- URL: https://www.wjgnet.com/1948-0210/full/v11/i1/44.htm
- DOI: https://dx.doi.org/10.4252/wjsc.v11.i1.44


