Copyright
©The Author(s) 2003.
World J Gastroenterol. Sep 15, 2003; 9(9): 2117-2120
Published online Sep 15, 2003. doi: 10.3748/wjg.v9.i9.2117
Published online Sep 15, 2003. doi: 10.3748/wjg.v9.i9.2117
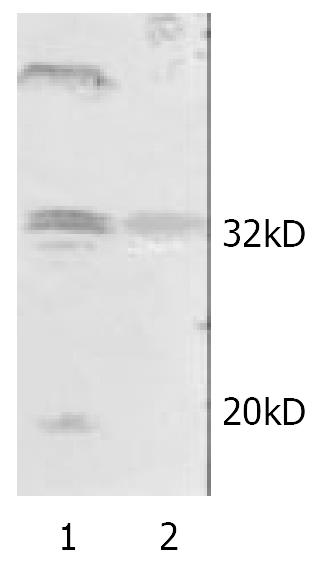
Figure 3 The expression of Caspase-3.
All the control groups showed weak signals at the position of 32kD, suggesting the presence of Caspase-3 (Lane 2). For the ATRA-treated cells, the 32kD signal was shown to be stronger. In addition, an-other signal at the position of 20kD was detected. The latter represented the p20 subunit of Caspase-3, an active form of the molecule (Lane 1).
- Citation: Piao YF, Shi Y, Gao PJ. Inhibitory effect of all-trans retinoic acid on human hepatocellular carcinoma cell proliferation. World J Gastroenterol 2003; 9(9): 2117-2120
- URL: https://www.wjgnet.com/1007-9327/full/v9/i9/2117.htm
- DOI: https://dx.doi.org/10.3748/wjg.v9.i9.2117


