Copyright
©The Author(s) 2003.
World J Gastroenterol. Aug 15, 2003; 9(8): 1844-1847
Published online Aug 15, 2003. doi: 10.3748/wjg.v9.i8.1844
Published online Aug 15, 2003. doi: 10.3748/wjg.v9.i8.1844
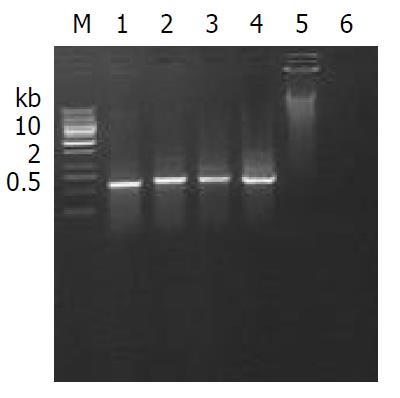
Figure 4 Electrophoresis analysis of PCR products amplified from DNA obtained from F1 mice tail tissues.
Lanes 1-4 (transgenic mice) : positive bands (600 bp), lane 5: normal mouse (negative control), lane 6: blank control, M: Generuler of 1Kb DNA landar.
- Citation: Zhu HZ, Chen JQ, Cheng GX, Xue JL. Generation and characterization of transgenic mice expressing tamoxifen-inducible cre-fusion protein specifically in mouse liver. World J Gastroenterol 2003; 9(8): 1844-1847
- URL: https://www.wjgnet.com/1007-9327/full/v9/i8/1844.htm
- DOI: https://dx.doi.org/10.3748/wjg.v9.i8.1844


