Copyright
©The Author(s) 2003.
World J Gastroenterol. Aug 15, 2003; 9(8): 1767-1771
Published online Aug 15, 2003. doi: 10.3748/wjg.v9.i8.1767
Published online Aug 15, 2003. doi: 10.3748/wjg.v9.i8.1767
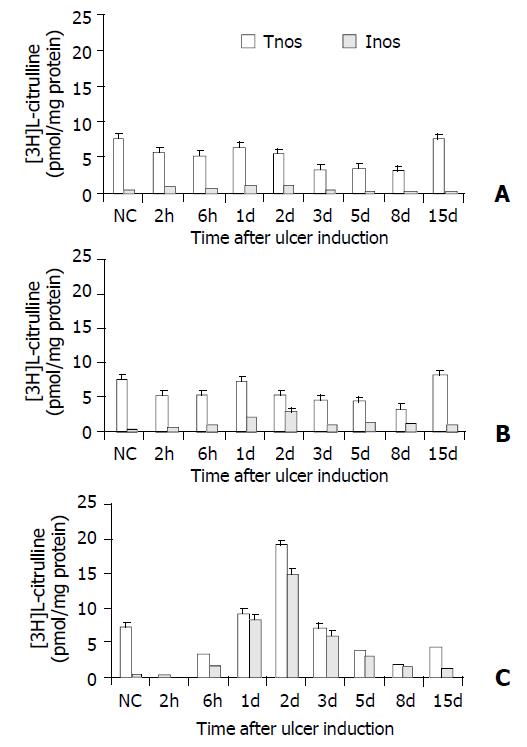
Figure 4 Total NOS (tnos) and iNOS (inos) activities at the non-ulcerated tissues (A), margins (B), and ulcer base (C) of acetic acid induced gastric ulcer.
Each bar represents the mean ± S.E.M of 8 rats in each group. NC = normal control group.
- Citation: Guo JS, Cho CH, Wang WP, Shen XZ, Cheng CL, Koo MWL. Expression and activities of three inducible enzymes in the healing of gastric ulcers in rats. World J Gastroenterol 2003; 9(8): 1767-1771
- URL: https://www.wjgnet.com/1007-9327/full/v9/i8/1767.htm
- DOI: https://dx.doi.org/10.3748/wjg.v9.i8.1767


