Copyright
©The Author(s) 2003.
World J Gastroenterol. Aug 15, 2003; 9(8): 1767-1771
Published online Aug 15, 2003. doi: 10.3748/wjg.v9.i8.1767
Published online Aug 15, 2003. doi: 10.3748/wjg.v9.i8.1767
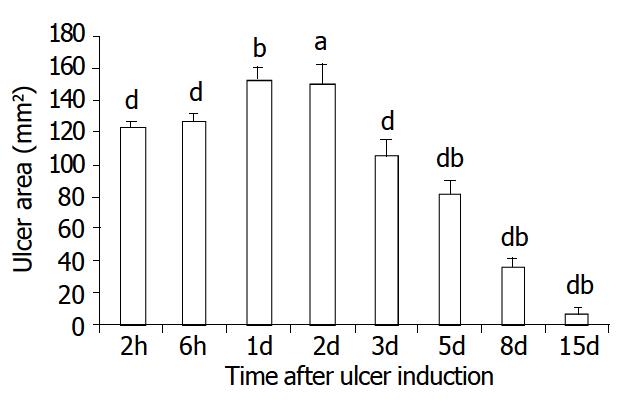
Figure 1 Sequential change of ulcer areas at different time points after ulcer induction.
Significant decrease of ulcer area was found on day 3 after ulcer induction. The data were represented as mean ± S. E. M of 20 rats in each group, aP < 0.05 vs the 2 h group; bP < 0.001 vs the 2 h group; dP < 0.001 vs the day 1 group.
- Citation: Guo JS, Cho CH, Wang WP, Shen XZ, Cheng CL, Koo MWL. Expression and activities of three inducible enzymes in the healing of gastric ulcers in rats. World J Gastroenterol 2003; 9(8): 1767-1771
- URL: https://www.wjgnet.com/1007-9327/full/v9/i8/1767.htm
- DOI: https://dx.doi.org/10.3748/wjg.v9.i8.1767


