Copyright
©The Author(s) 2003.
World J Gastroenterol. Jun 15, 2003; 9(6): 1327-1332
Published online Jun 15, 2003. doi: 10.3748/wjg.v9.i6.1327
Published online Jun 15, 2003. doi: 10.3748/wjg.v9.i6.1327
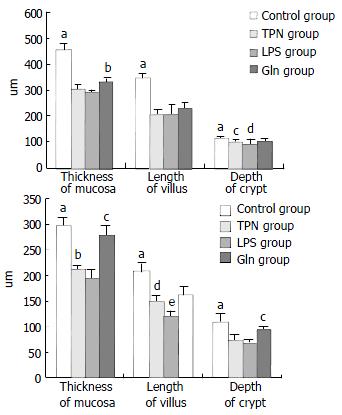
Figure 3 Graphs of morphometry of small intestinal mucosa.
(a) Morphometry of jejunal mucous membrane; aP < 0.01, vs TPN group, LPS group and Gln group; bP < 0.01, vs TPN group and LPS group; cP < 0.02, vs LPS group; dP < 0.04, vs Gln group; (b) Morphometry of ileal mucous membrane; aP< 0.004, vs TPN group, LPS group and Gln group; bP < 0.005, vs LPS group; cP < 0.02, vs Gln group; dP < 0.02, vs Gln group; eP < 0.001, vs TPN group and Gln group.
- Citation: Ding LA, Li JS. Effects of glutamine on intestinal permeability and bacterial translocation in TPN-rats with endotoxemia. World J Gastroenterol 2003; 9(6): 1327-1332
- URL: https://www.wjgnet.com/1007-9327/full/v9/i6/1327.htm
- DOI: https://dx.doi.org/10.3748/wjg.v9.i6.1327


