Copyright
©The Author(s) 2003.
World J Gastroenterol. Jun 15, 2003; 9(6): 1256-1260
Published online Jun 15, 2003. doi: 10.3748/wjg.v9.i6.1256
Published online Jun 15, 2003. doi: 10.3748/wjg.v9.i6.1256
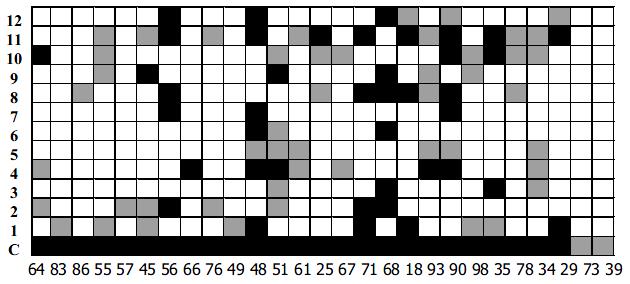
Figure 5 Reaction of the 12 representative HVR1s and chimera HVR1antigen (C) with 27 sera from HCV-infected patients.
HVR1 names are indicated at the left of each column. For each serum (indicated on the bottom of each column) average values (A450) have been determined from two independent experiments. The mean of 10 sera from non-infected individuals plus 4SD defined the cutoff (co). Results were expressed as the difference between the average value of the HCV antibody positive sera and co. Strong positive values (> 0.5) are indicated in black. And weak positive values are indicated in grey (0.15-0.5).
- Citation: Xiu BS, Ling SG, Song XG, Zhang HQ, Chen K, Zhu CX. Cross-reactivity of hypervariable region 1 chimera of hepatitis C virus. World J Gastroenterol 2003; 9(6): 1256-1260
- URL: https://www.wjgnet.com/1007-9327/full/v9/i6/1256.htm
- DOI: https://dx.doi.org/10.3748/wjg.v9.i6.1256


