Copyright
©The Author(s) 2003.
World J Gastroenterol. Apr 15, 2003; 9(4): 765-770
Published online Apr 15, 2003. doi: 10.3748/wjg.v9.i4.765
Published online Apr 15, 2003. doi: 10.3748/wjg.v9.i4.765
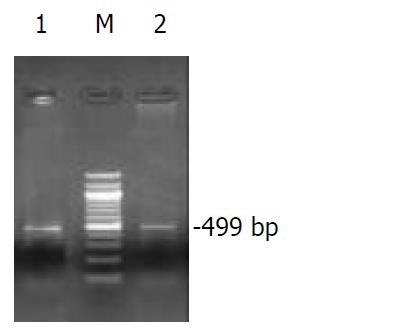
Figure 3 Comparison of GHR mRNA expression in liver tis-sue in normal control group and cirrhotic model group (the result of RT-PCR).
Lane M: 100 bp DNA ladder; Lane 1: Nor-mal control group; Lane 2: Cirrhotic model group.
- Citation: Wang HT, Chen S, Wang J, Ou QJ, Liu C, Zheng SS, Deng MH, Liu XP. Expression of growth hormone receptor and its mRNA in hepatic cirrhosis. World J Gastroenterol 2003; 9(4): 765-770
- URL: https://www.wjgnet.com/1007-9327/full/v9/i4/765.htm
- DOI: https://dx.doi.org/10.3748/wjg.v9.i4.765


