Copyright
©The Author(s) 2003.
World J Gastroenterol. Apr 15, 2003; 9(4): 759-764
Published online Apr 15, 2003. doi: 10.3748/wjg.v9.i4.759
Published online Apr 15, 2003. doi: 10.3748/wjg.v9.i4.759
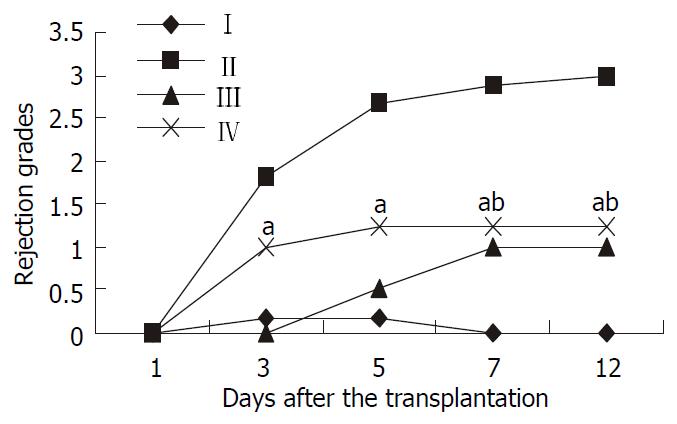
Figure 1 Rejection grades of grafted liver in different groups.
Data were expressed as mean ± SD. I, Wistar-Wistar group; II, SD-Wistar group; III, SD-Wistar + CsA group; IV, LSA + SD-Wistar group; Rejection grades of group IV were significantly lower than that in group II at all but day 1 time point. No sig-nificant discrepancies were found between group IV and group III on day 7 and day 12 time points. aP < 0.05 vs group II, bP > 0.05 vs group III.
- Citation: Jia CK, Zheng SS, Li QY, Zhang AB. Immunotolerance of liver allotransplantation induced by intrathymic inoculation of donor soluble liver specific antigen. World J Gastroenterol 2003; 9(4): 759-764
- URL: https://www.wjgnet.com/1007-9327/full/v9/i4/759.htm
- DOI: https://dx.doi.org/10.3748/wjg.v9.i4.759


