Copyright
©The Author(s) 2003.
World J Gastroenterol. Dec 15, 2003; 9(12): 2732-2736
Published online Dec 15, 2003. doi: 10.3748/wjg.v9.i12.2732
Published online Dec 15, 2003. doi: 10.3748/wjg.v9.i12.2732
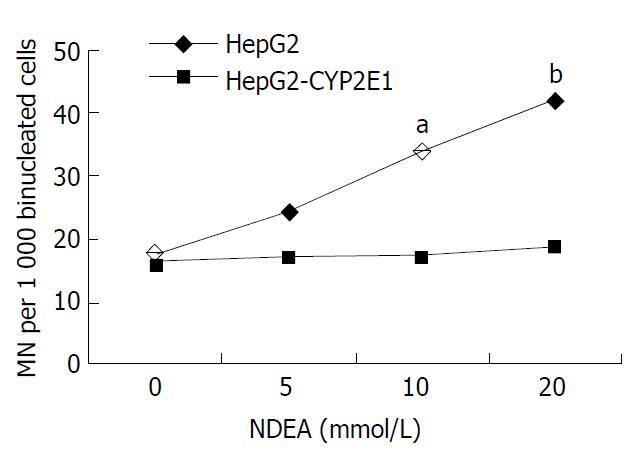
Figure 5 MN rates in HepG2-CYP2E1 and HepG2 cells in-duced by NDEA.
Cells were exposed to various concentrations of NDEA. The data were expressed as per thousand of binucleated cells with MN. aP < 0.05, bP < 0.01 vs HepG2 cells.
- Citation: Zhuge J, Luo Y, Yu YN. Heterologous expression of human cytochrome P450 2E1 in HepG2 cell line. World J Gastroenterol 2003; 9(12): 2732-2736
- URL: https://www.wjgnet.com/1007-9327/full/v9/i12/2732.htm
- DOI: https://dx.doi.org/10.3748/wjg.v9.i12.2732


