Copyright
©The Author(s) 2003.
World J Gastroenterol. Dec 15, 2003; 9(12): 2676-2680
Published online Dec 15, 2003. doi: 10.3748/wjg.v9.i12.2676
Published online Dec 15, 2003. doi: 10.3748/wjg.v9.i12.2676
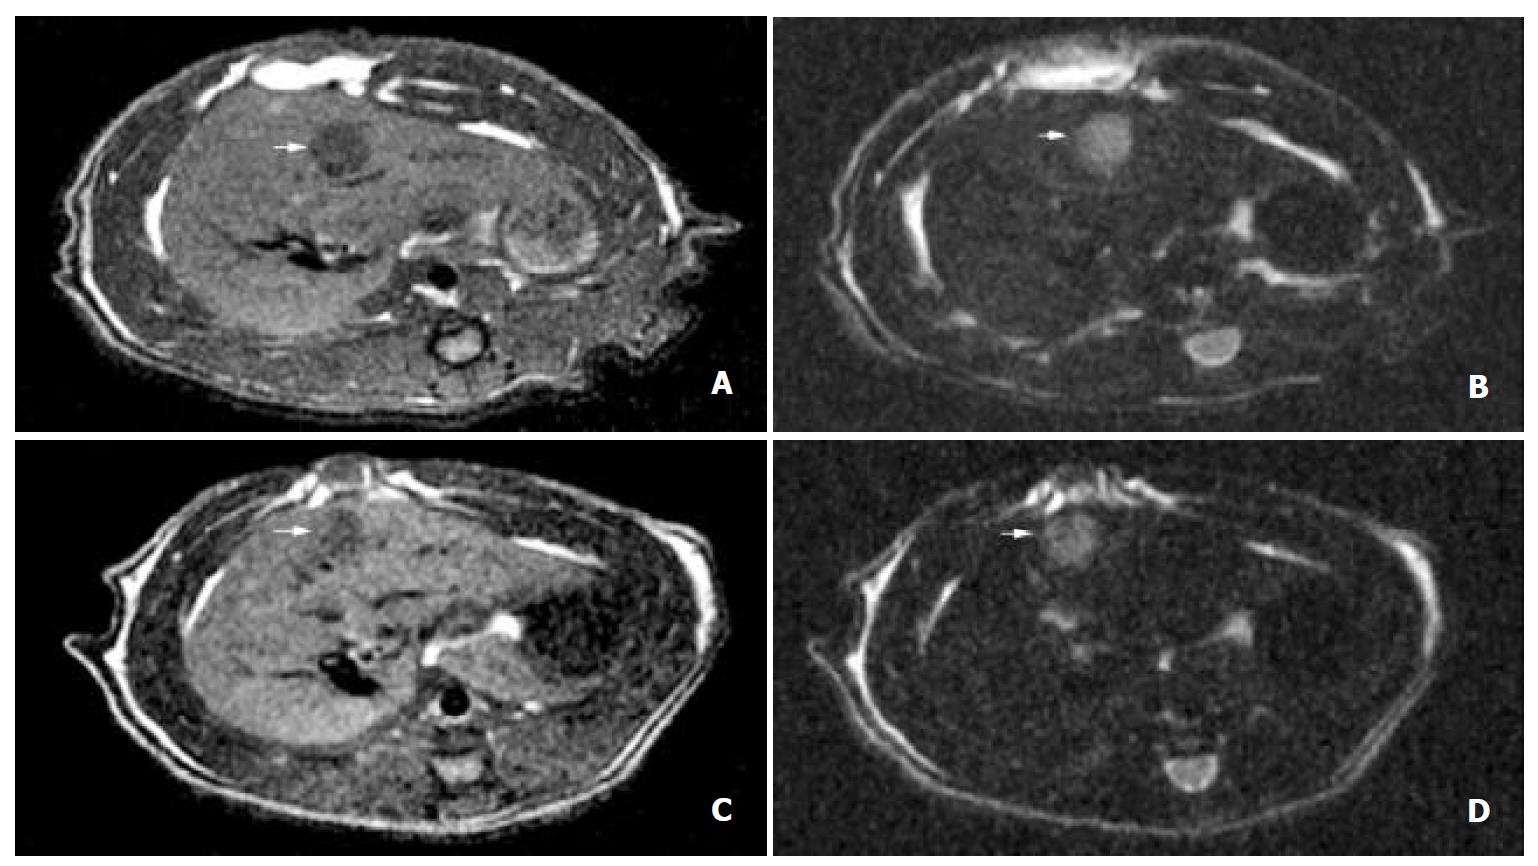
Figure 1 A: Images in a ACI rat with a solid HCC in group B.
(a) Pretherapy did not enhance T1-weighted MR imaging with SE sequence (460/15). It shows a small hypointense tumor (arrow) in the left lateral lobe of liver; B: Pretherapeutic unenhanced T2-weighted MR imaging with TSE sequence (3170/99). The hyperintense lesion with a size of 0.44×0.40 mm2 (arrow) is well discern-ible from the surrounding liver tissue. C: Images in a ACI rat with a solid HCC in group B. (a) Posttherapy did not enhance T1-weighted MR imaging with SE sequence (460/15). It shows a small hypointense tumor (arrow) in the left lateral lobe of liver. D: Unenhanced T2-weighted MR imaging with TSE sequence (3170/99) after therapy. It shows the inhomogeneous hyperintense lesion with a size of 0.44 × 0.38 mm2 (arrow) and demonstrates that there is no difference between the tumor volume before and after therapy.
-
Citation: Qian J, Vossoughi D, Woitaschek D, Oppermann E, Bechstein WO, Li WY, Feng GS, Vogl T. Combined transarterial chemoembolization and arterial administration of
Bletilla striata in treatment of liver tumor in rats. World J Gastroenterol 2003; 9(12): 2676-2680 - URL: https://www.wjgnet.com/1007-9327/full/v9/i12/2676.htm
- DOI: https://dx.doi.org/10.3748/wjg.v9.i12.2676


