Copyright
©The Author(s) 2003.
World J Gastroenterol. Nov 15, 2003; 9(11): 2433-2440
Published online Nov 15, 2003. doi: 10.3748/wjg.v9.i11.2433
Published online Nov 15, 2003. doi: 10.3748/wjg.v9.i11.2433
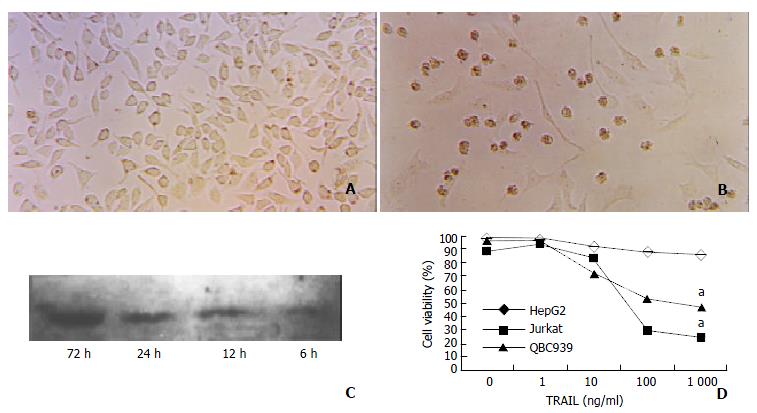
Figure 3 Determination of the percentage of cell viability by in vitro administration of recombinant TRAIL.
A: Normal HepG2 shapes; B: HepG2 shaped treatment with TRAIL (100 ng/mL, 24 h); C: Western blot analyzed expression of TRAIL protein transfected with pIRES-EGFP-TRAIL (6 h, 12 h, 24 h 72 h). D:Survival of tumor cells treatment with TRAIL, detected by MTT. Each value represents the mean of the three wells. For clarity, SD bars are omitted from the graph, but are less than 5% for all data points. Experiments were performed at least three separate times with similar results. a: Compared with hepG2, statistical significant (P < 0.05). The results similar to HepG2 were obtained in SMMC-7721.
- Citation: Chen XP, He SQ, Wang HP, Zhao YZ, Zhang WG. Expression of TNF-related apoptosis-inducing Ligand receptors and antitumor tumor effects of TNF-related apoptosis-inducing Ligand in human hepatocellular carcinoma. World J Gastroenterol 2003; 9(11): 2433-2440
- URL: https://www.wjgnet.com/1007-9327/full/v9/i11/2433.htm
- DOI: https://dx.doi.org/10.3748/wjg.v9.i11.2433


