Copyright
©The Author(s) 2003.
World J Gastroenterol. Oct 15, 2003; 9(10): 2317-2321
Published online Oct 15, 2003. doi: 10.3748/wjg.v9.i10.2317
Published online Oct 15, 2003. doi: 10.3748/wjg.v9.i10.2317
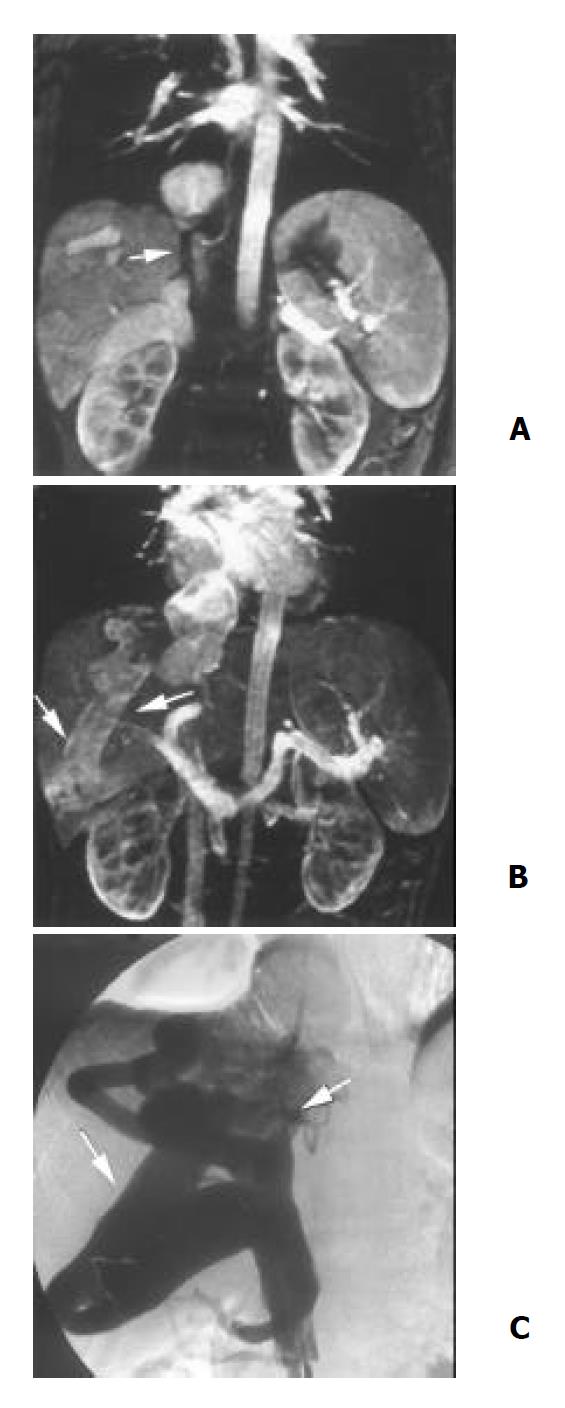
Figure 3 A: Source image depicts occlusion of the inferior vena cava(arrowhead).
B: Maximum intensity projection of three-dimensional contrast-enhanced magnetic resonance angiogra-phy depicts tortuous intrahepatic collaterals (arrows) between right inferior accessory hepatic vein and right main hepatic vein. C: Inferior vena cavography confirms the occlusion of the inferior vena cava (arrowhead) and the intrahepatic collaterals (arrow).
- Citation: Lin J, Chen XH, Zhou KR, Chen ZW, Wang JH, Yan ZP, Wang P. Budd-Chiari syndrome: Diagnosis with three-dimensional contrast-enhanced magnetic resonance angiography. World J Gastroenterol 2003; 9(10): 2317-2321
- URL: https://www.wjgnet.com/1007-9327/full/v9/i10/2317.htm
- DOI: https://dx.doi.org/10.3748/wjg.v9.i10.2317


