Copyright
©The Author(s) 2003.
World J Gastroenterol. Jan 15, 2003; 9(1): 9-15
Published online Jan 15, 2003. doi: 10.3748/wjg.v9.i1.9
Published online Jan 15, 2003. doi: 10.3748/wjg.v9.i1.9
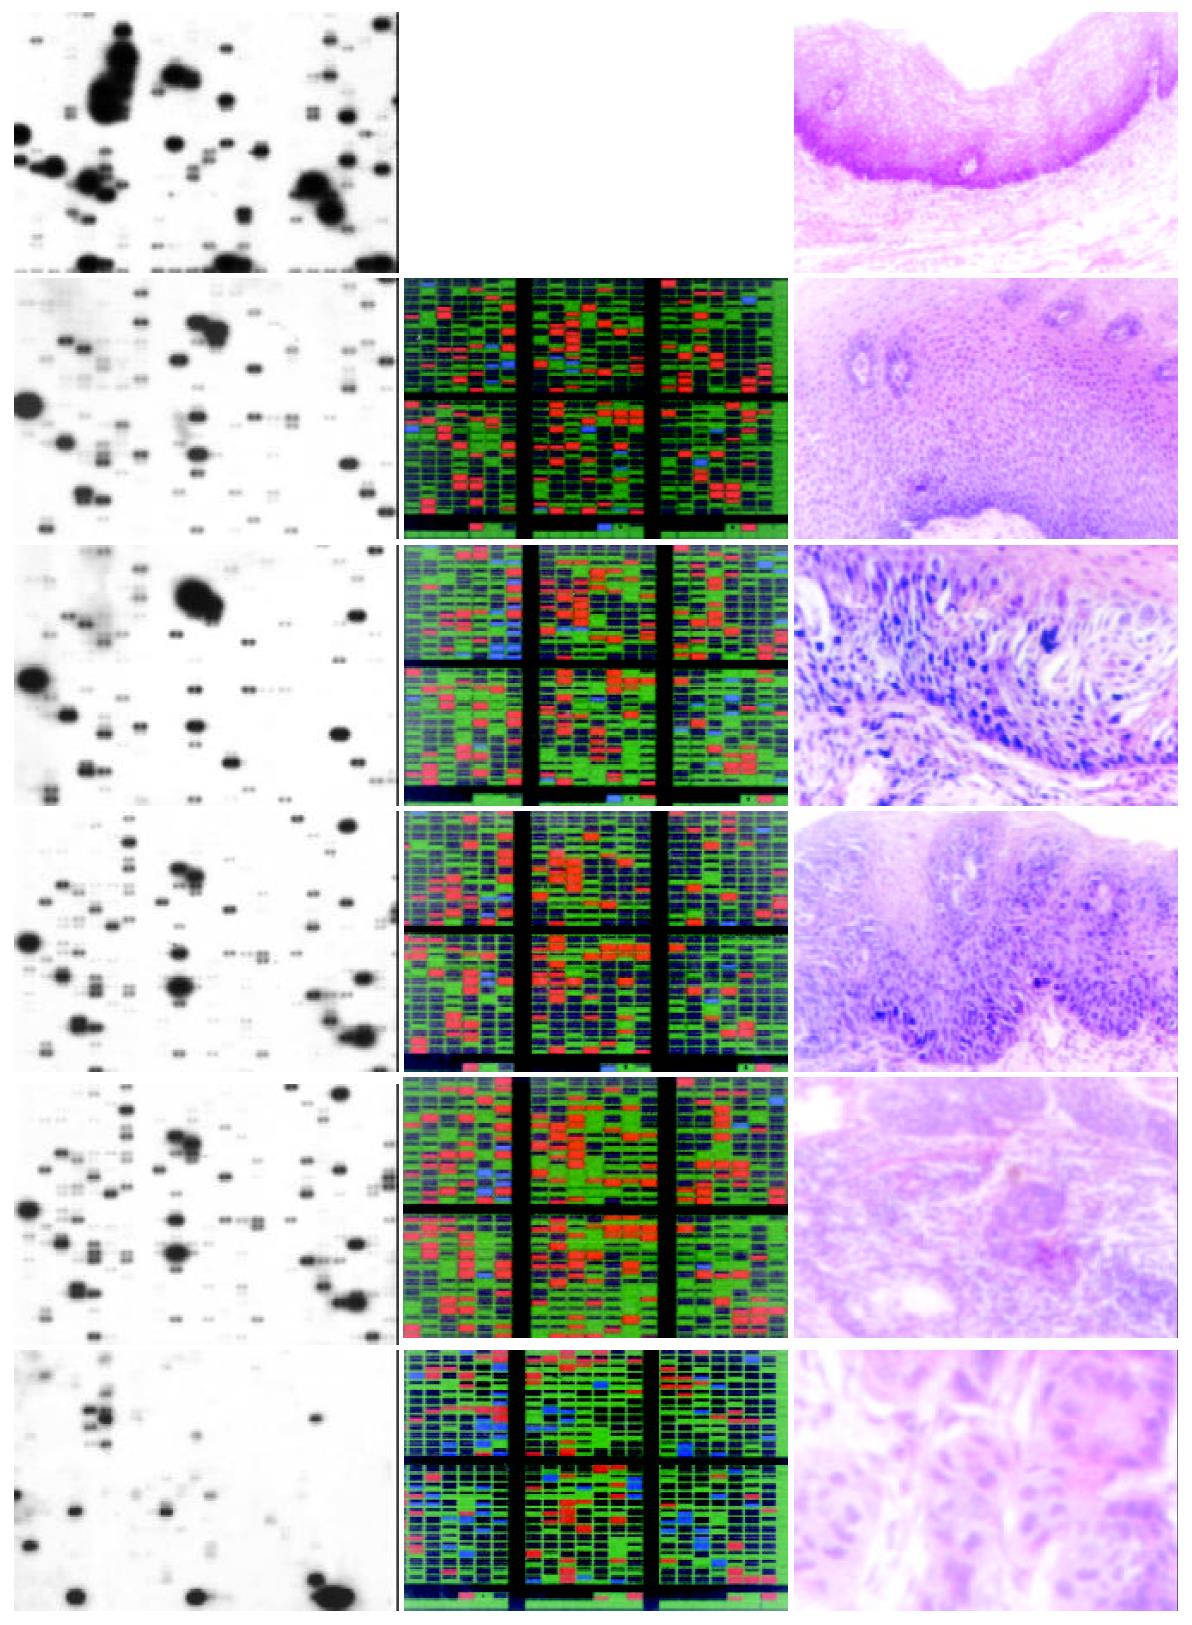
Figure 1 Expression patterns of genes in esophageal tissue of normal, basal cell hyperplasia, high-grade dysplasia, carcinoma in situ, early and advanced cancer.
Total RNAs were isolated from these tissues, reverse-transcribed into 32P-labeled cDNAs and hybridized to AtlasTM Human Cancer cDNA expression arrays. A complete list of names and location of the arrayed gene can be found in the instruction manual and website from Clontech. Data was analyzed by AtlasImageTM 1.01 software. A, B, C, D, E, F showed hybridization result of normal cells, basal cell hyperplasia, high-grade dysplasia, carcinoma in situ, early and advanced cancer; G, H, I, J, K showed the color charts indicating up-regulated genes with red, down-regulated genes with blue, and non-changed genes with green in the later 5 stages when compared to normal tissue; L, M, N, O, P showed the pathological image of normal, basal cell hyperplasia, high-grade dysplasia, carcinoma in situ, early and advanced cancer respectively.
- Citation: Zhou J, Zhao LQ, Xiong MM, Wang XQ, Yang GR, Qiu ZL, Wu M, Liu ZH. Gene expression profiles at different stages of human esophageal squamous cell carcinoma. World J Gastroenterol 2003; 9(1): 9-15
- URL: https://www.wjgnet.com/1007-9327/full/v9/i1/9.htm
- DOI: https://dx.doi.org/10.3748/wjg.v9.i1.9


