Copyright
©The Author(s) 2003.
World J Gastroenterol. Jan 15, 2003; 9(1): 169-173
Published online Jan 15, 2003. doi: 10.3748/wjg.v9.i1.169
Published online Jan 15, 2003. doi: 10.3748/wjg.v9.i1.169
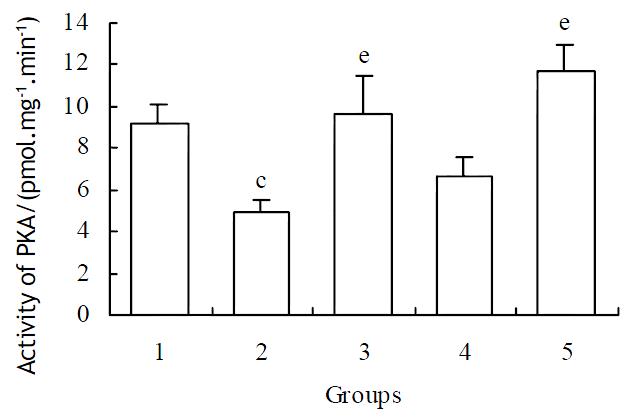
Figure 5 The effects of different concentration of naloxone on the intracellular activity of PKC in NS-1 cells.
Treatment groups: 1: control; 2: 1 × 10⁻⁶ mol·L-1 methionine enkephalin 3: 1 × 10⁻⁶ mol·L-1 methionine enkephalin plus 1 × 10⁻⁷ mol·L-1 naloxone; 4: 1 × 10⁻⁶ mol·L-1 methionine enkephalin plus 1 × 10⁻⁶ mol·L-1 naloxone; 5: 1 × 10⁻⁶ mol·L-1 methionine enkephalin plus 1 × 10⁻⁵ mol·L-1 naloxone. n = 3 from 3 independent experiments. cP < 0.01 vs control, eP < 0.05 vs group 2
- Citation: Liu XH, Huang DA, Yang FY, Hao YS, Du GG, Li PF, Li G. A new cytokine: the possible effect pathway of methionine enkephalin. World J Gastroenterol 2003; 9(1): 169-173
- URL: https://www.wjgnet.com/1007-9327/full/v9/i1/169.htm
- DOI: https://dx.doi.org/10.3748/wjg.v9.i1.169


