Copyright
©The Author(s) 2003.
World J Gastroenterol. Aug 15, 2003; 9(1): 125-128
Published online Aug 15, 2003. doi: 10.3748/wjg.v9.i1.125
Published online Aug 15, 2003. doi: 10.3748/wjg.v9.i1.125
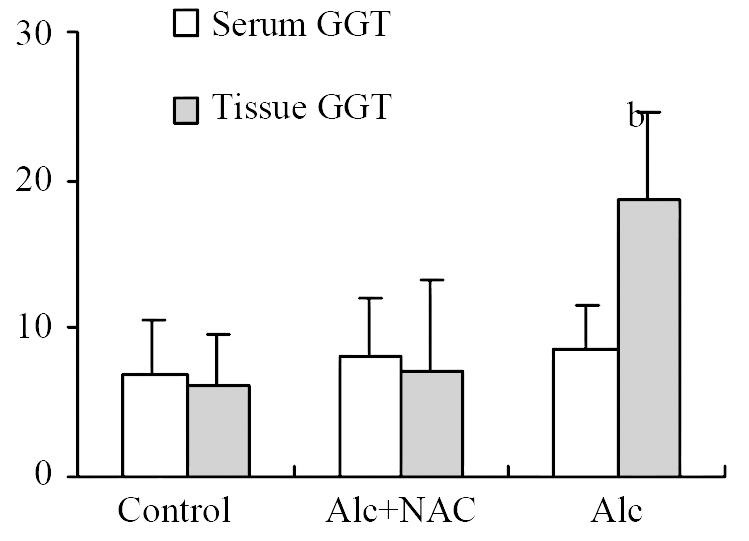
Figure 2 Serum (U/L) and tissue (U/g-protein) GGT levels.
Alc: Alcohol, NAC: N-acetylcysteine, bP < 0.001 vs control and Alc + NAC group.
- Citation: Ozaras R, Tahan V, Aydin S, Uzun H, Kaya S, Senturk H. N-acetylcysteine attenuates alcohol-induced oxidative stress in he rat. World J Gastroenterol 2003; 9(1): 125-128
- URL: https://www.wjgnet.com/1007-9327/full/v9/i1/125.htm
- DOI: https://dx.doi.org/10.3748/wjg.v9.i1.125


