Copyright
©The Author(s) 2002.
World J Gastroenterol. Dec 15, 2002; 8(6): 966-970
Published online Dec 15, 2002. doi: 10.3748/wjg.v8.i6.966
Published online Dec 15, 2002. doi: 10.3748/wjg.v8.i6.966
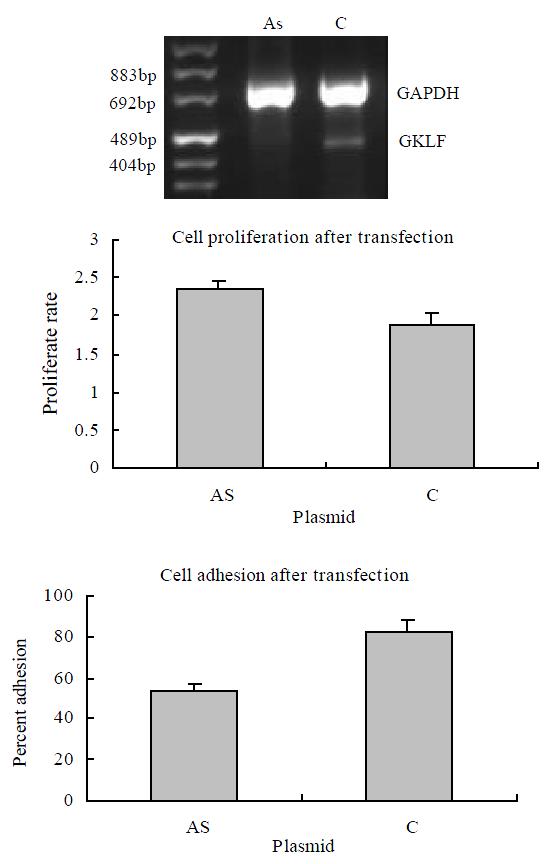
Figure 3 Cell growth and adhesion in GKLF transfected EC9706 cells.
The cells were transiently transfected with antisense GKLF expression plasmid (AS) and pCDNA3.1 as control (C). The GKLF expression levels detected by RT-PCR were shown in the upper panel. The cell growth rates were shown in the middle panel; each data point represents mean ± S.E.M. of 7 repeats; there was a significant difference between AS and C (P < 0.05). The cell adhesions were shown in the lower panel; each data point represents mean ± S.E.M. of 4 repeats; AS had significant difference compared to C (P < 0.05).
- Citation: Wang N, Liu ZH, Ding F, Wang XQ, Zhou CN, Wu M. Down-regulation of gut-enriched Krüppel-like factor expression in esophageal cancer. World J Gastroenterol 2002; 8(6): 966-970
- URL: https://www.wjgnet.com/1007-9327/full/v8/i6/966.htm
- DOI: https://dx.doi.org/10.3748/wjg.v8.i6.966


