Copyright
©The Author(s) 2002.
World J Gastroenterol. Aug 15, 2002; 8(4): 631-637
Published online Aug 15, 2002. doi: 10.3748/wjg.v8.i4.631
Published online Aug 15, 2002. doi: 10.3748/wjg.v8.i4.631
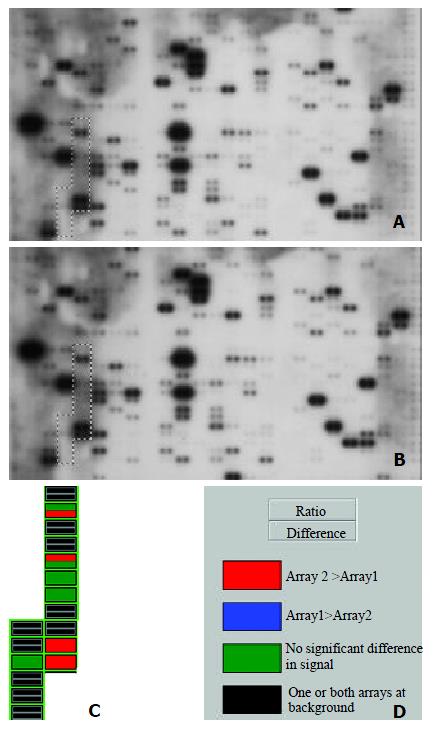
Figure 1 Parallel analysis of intergrin gene expression in human hepatocellular carcinoma and adjacent normal liver tissues.
Atlas human cancer cDNA expression array (Clontech, USA) is hybridized with 32P-labeled cDNA probes obtained by RT-PCR from total RNA of human hepatocellular carcinoma (A) and adjacent normal liver tissues (B). The intergrin gene region is marked in the photo. The colorful comparative diagram between human hepatocellular carcinoma and adjacent normal liver tissues is obtained when one aligns two arrays to AtlasImage Grid Temples and adjusts the alignments and backgroud calculations (C). Definitions of colors in the array comparison are showed (D).
- Citation: Liu LX, Jiang HC, Liu ZH, Zhou J, Zhang WH, Zhu AL, Wang XQ, Wu M. Intergrin gene expression profiles of humanhepatocellular carcinoma. World J Gastroenterol 2002; 8(4): 631-637
- URL: https://www.wjgnet.com/1007-9327/full/v8/i4/631.htm
- DOI: https://dx.doi.org/10.3748/wjg.v8.i4.631


