Copyright
©The Author(s) 2002.
World J Gastroenterol. Jun 15, 2002; 8(3): 524-527
Published online Jun 15, 2002. doi: 10.3748/wjg.v8.i3.524
Published online Jun 15, 2002. doi: 10.3748/wjg.v8.i3.524
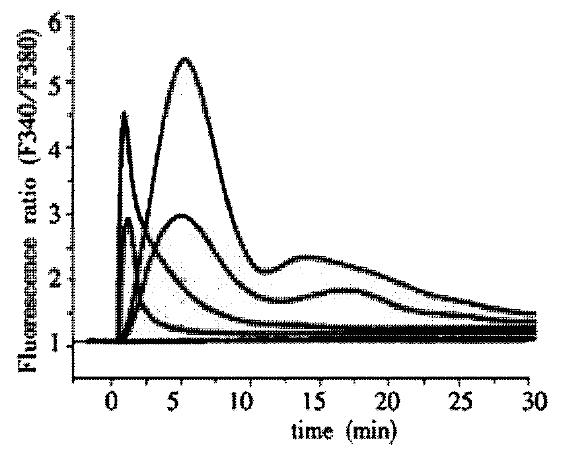
Figure 2 Kinetics of SA (I) and CCK-8 evoked [Ca2+]i and effects of GDP in a single rat pancreatic acinar cell.
[Ca2+]i were expressed by Fluorescence ratio F340/F380. a. 1 × 10⁻⁹ mol/L CCk-8; b. 1 × 10⁻⁹ mol/L CCk-8 + 5 × 10⁻³ mol/L GDP; c. 5 × 10⁻⁶ mol/L SA (I); d. 5 × 10⁻⁶ mol/L SA (I) + 5 × 10⁻³ mol/L GDP; e. Base. Time 0 is determined by the time of adding drug.
- Citation: Yu Y, Yang WX, Wang H, Zhang WZ, Liu BH, Dong ZY. Characteristics and mechanism of enzyme secretion and increase in [Ca2+]i in Saikosaponin (I) stimulated rat pancreatic acinar cells. World J Gastroenterol 2002; 8(3): 524-527
- URL: https://www.wjgnet.com/1007-9327/full/v8/i3/524.htm
- DOI: https://dx.doi.org/10.3748/wjg.v8.i3.524


