Copyright
©The Author(s) 2002.
World J Gastroenterol. Jun 15, 2002; 8(3): 469-475
Published online Jun 15, 2002. doi: 10.3748/wjg.v8.i3.469
Published online Jun 15, 2002. doi: 10.3748/wjg.v8.i3.469
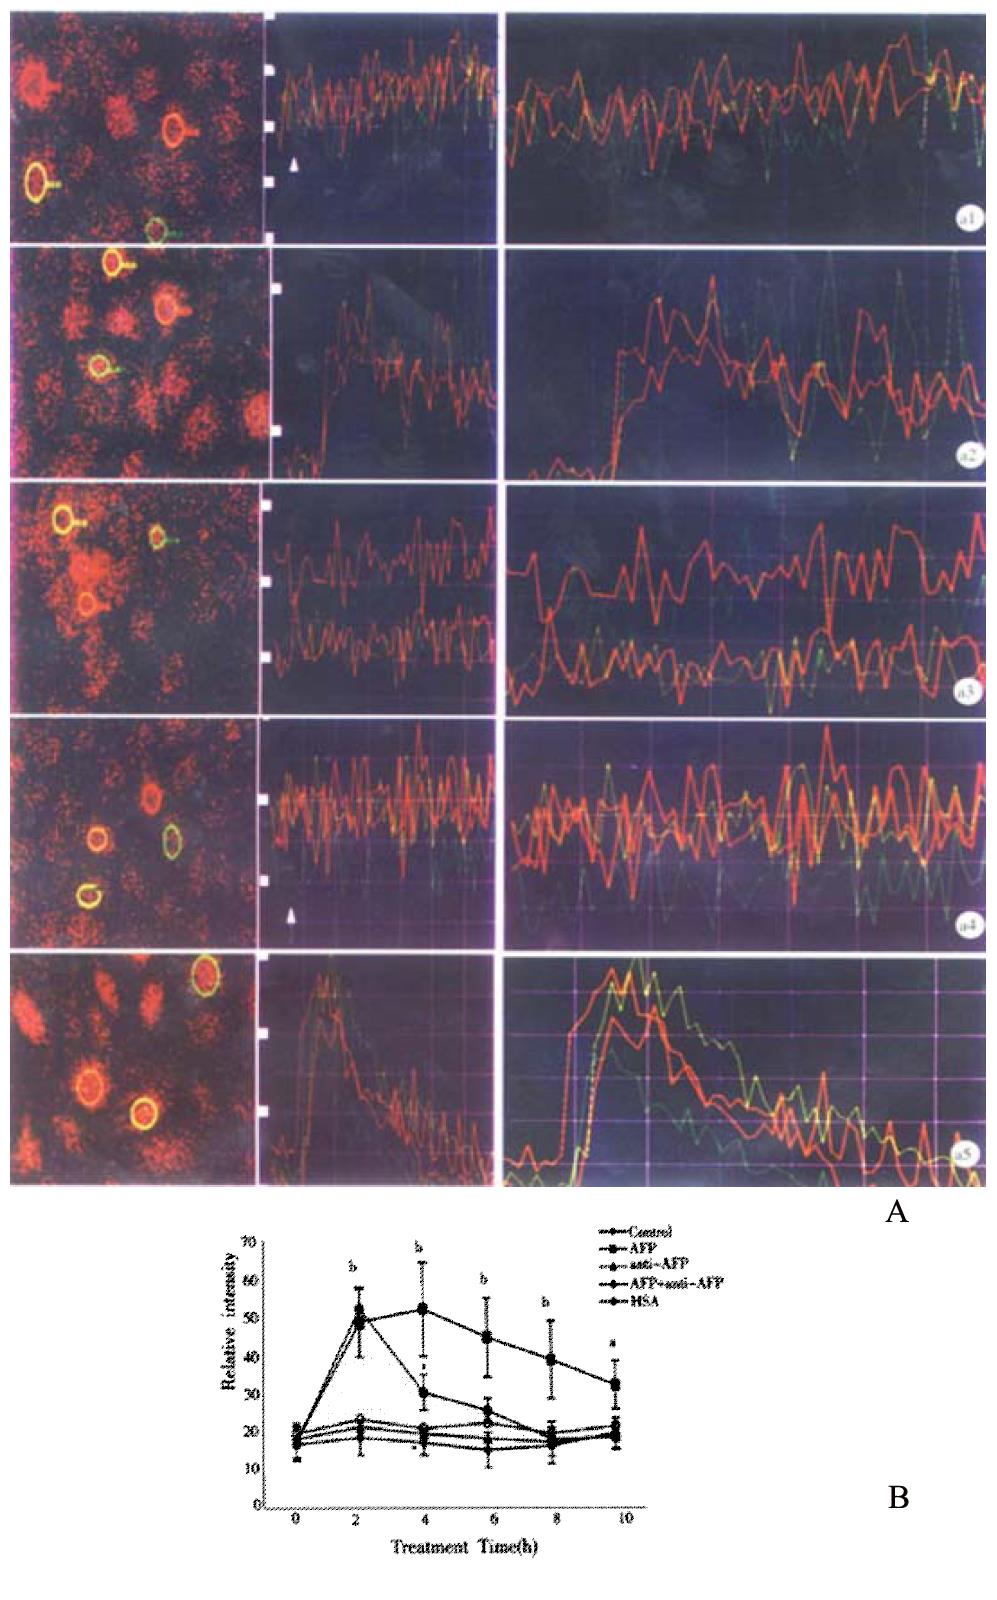
Figure 6 A: The change of Ca2+ concentration in human hepatoma Bel7402 cells was measured by confocal microscopic scanning.
Cells were incubated with 5 μmol·L-1 fluo-3/AM at 37 °C for 30 min and then stimulated with Hank’s. (1) AFP (20 mg·L-1); (2) HSA (20 mg·L-1); (3) Anti-AFP; (40 mg·L-1); (4) or AFP (20 mg·L-1) + Anti-AFP (40 mg·L-1); (5) The arrow indicate the stimulated time point. B: The graph shows the scanning results. The data represented as the mean value of 10 cells ± s. aP < 0.05 and bP < 0.01 vs control (0 mol·L-1)
- Citation: Li MS, Li PF, He SP, Du GG, Li G. The promoting molecular mechanism of alpha-fetoprotein on the growth of human hepatoma Bel7402 cell line. World J Gastroenterol 2002; 8(3): 469-475
- URL: https://www.wjgnet.com/1007-9327/full/v8/i3/469.htm
- DOI: https://dx.doi.org/10.3748/wjg.v8.i3.469


