Copyright
©The Author(s) 200.
World J Gastroenterol. Jun 15, 2002; 8(3): 413-417
Published online Jun 15, 2002. doi: 10.3748/wjg.v8.i3.413
Published online Jun 15, 2002. doi: 10.3748/wjg.v8.i3.413
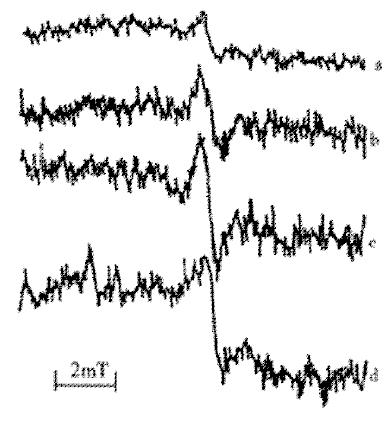
Figure 2 ESR spectra of bilirubin treated with: (a) Bilirubin (from Sigma) as control; (b) 60Co (100Gy); (c) ·OH (Fe (II) + EDTA); (d) O2·- (XO/XOD).
The relative intensity of ESR peak is: a:b:c:d = 1:2.1:2.8:3.9
- Citation: Liu XT, Hu J. Relationship between bilirubin free radical and formation of pigment gallstone. World J Gastroenterol 2002; 8(3): 413-417
- URL: https://www.wjgnet.com/1007-9327/full/v8/i3/413.htm
- DOI: https://dx.doi.org/10.3748/wjg.v8.i3.413


