Copyright
©The Author(s) 2002.
World J Gastroenterol. Feb 15, 2002; 8(1): 144-149
Published online Feb 15, 2002. doi: 10.3748/wjg.v8.i1.144
Published online Feb 15, 2002. doi: 10.3748/wjg.v8.i1.144
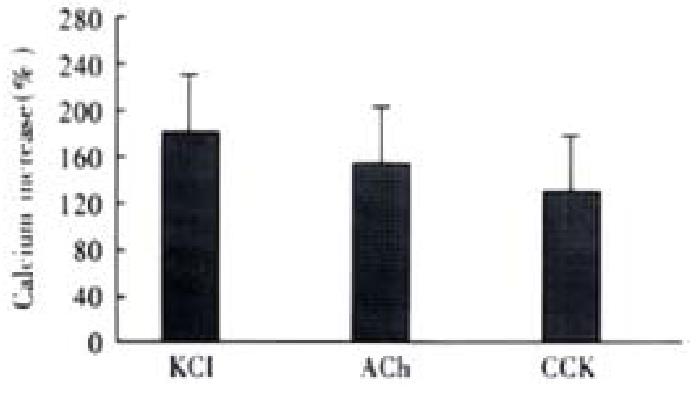
Figure 3 Intracellular fluorescence increases induced by different agonists.
Ca2+ Concentration increased from resting level of 108 ± 21 nmol·L-1 to 297 ± 66 nmol·L-1, 275 ± 58 nmol·L-1 and 251 ± 45 nmol·L-1, respectively. ANOVA was performed for the analysis, F = 0.9184, no significant difference be-tween three groups (n = 4).
- Citation: Wang XJ, Wei JG, Wang CM, Wang YC, Wu QZ, Xu JK, Yang XX. Effect of cholesterol liposomes on calcium mobilization in muscle cells from the rabbit sphincter of Oddi. World J Gastroenterol 2002; 8(1): 144-149
- URL: https://www.wjgnet.com/1007-9327/full/v8/i1/144.htm
- DOI: https://dx.doi.org/10.3748/wjg.v8.i1.144


