Copyright
©The Author(s) 2001.
World J Gastroenterol. Oct 15, 2001; 7(5): 630-636
Published online Oct 15, 2001. doi: 10.3748/wjg.v7.i5.630
Published online Oct 15, 2001. doi: 10.3748/wjg.v7.i5.630
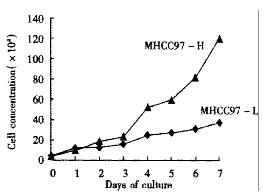
Figure 5 Cell growth curve of two clones.
4 × 10⁴ viable cells were cultured in each well of the 24 well culture plate. Cell numbers were determined for 7 consecutive days. Each time point represents the mean of duplicate cell counts.
- Citation: Li Y, Tang ZY, Ye SL, Liu YK, Chen J, Xue Q, Chen J, Gao DM, Bao WH. Establishment of cell clones with different metastatic potential from the metastatic hepatocellular carcinoma cell line MHCC97. World J Gastroenterol 2001; 7(5): 630-636
- URL: https://www.wjgnet.com/1007-9327/full/v7/i5/630.htm
- DOI: https://dx.doi.org/10.3748/wjg.v7.i5.630


