Copyright
©The Author(s) 2001.
World J Gastroenterol. Apr 15, 2001; 7(2): 275-280
Published online Apr 15, 2001. doi: 10.3748/wjg.v7.i2.275
Published online Apr 15, 2001. doi: 10.3748/wjg.v7.i2.275
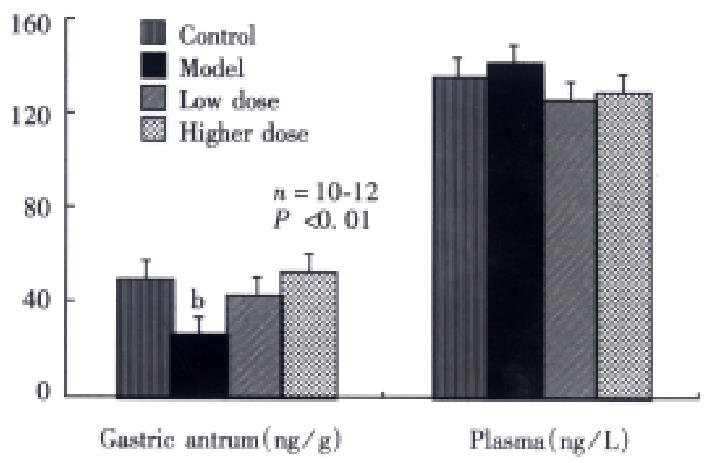
Figure 6 Gastrin level in four groups.
Data are presented as the mean ± SE from 10-12 rats.bStatistically significant difference from blank control, t = 2.53, P < 0.01.
- Citation: Du YP, Zhang YP, Wang SC, Shi J, Wu SH. Function and regulation of cholecystokinin octapeptide, β-endorp hin and gastrin in anorexic infantile rats treated with ErBao Granules. World J Gastroenterol 2001; 7(2): 275-280
- URL: https://www.wjgnet.com/1007-9327/full/v7/i2/275.htm
- DOI: https://dx.doi.org/10.3748/wjg.v7.i2.275


