Copyright
©The Author(s) 2001.
World J Gastroenterol. Apr 15, 2001; 7(2): 275-280
Published online Apr 15, 2001. doi: 10.3748/wjg.v7.i2.275
Published online Apr 15, 2001. doi: 10.3748/wjg.v7.i2.275
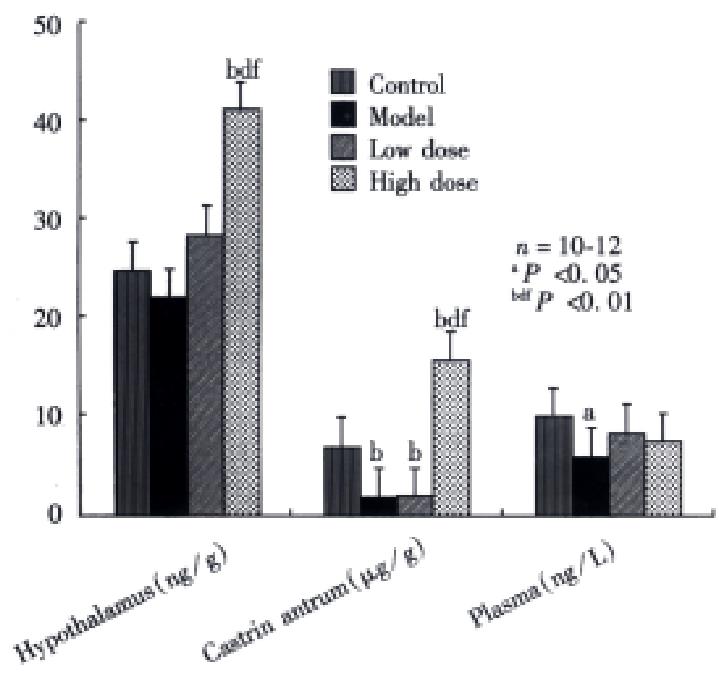
Figure 4 β-EP level between groups.
Data are presented as the mean ± SE from 9-10 rats. aStatistically significant difference from blank control, bP < 0.05, dP < 0.01; from model control, fP < 0.01; from low dose, P < 0.01. In hypothalamus, β- EP level in the high dose group was higher than in the blank control group (t = 4.79, P< 0.01), model control group (t = 4. 82, P < 0.01), and low dose group (t = 3.55, P<0.01). In gastric antrum, β-EP levels of model control group and low dose group were lower than in the blank control group (t = 9.05, P < 0.01; t = 10.79, P < 0.01), but β-EP level of high dose group increased more significantly than blank control group (t = 7. 75, P < 0.01), model control group (t = 11.34, P < 0.01), and low dose group (t = 12.76, P < 0.01). In plasma, β-EP level of model control group was lower than in the blank control group (t = 1.79, P < 0.05).
- Citation: Du YP, Zhang YP, Wang SC, Shi J, Wu SH. Function and regulation of cholecystokinin octapeptide, β-endorp hin and gastrin in anorexic infantile rats treated with ErBao Granules. World J Gastroenterol 2001; 7(2): 275-280
- URL: https://www.wjgnet.com/1007-9327/full/v7/i2/275.htm
- DOI: https://dx.doi.org/10.3748/wjg.v7.i2.275


