Copyright
©The Author(s) 2001.
World J Gastroenterol. Feb 15, 2001; 7(1): 37-41
Published online Feb 15, 2001. doi: 10.3748/wjg.v7.i1.37
Published online Feb 15, 2001. doi: 10.3748/wjg.v7.i1.37
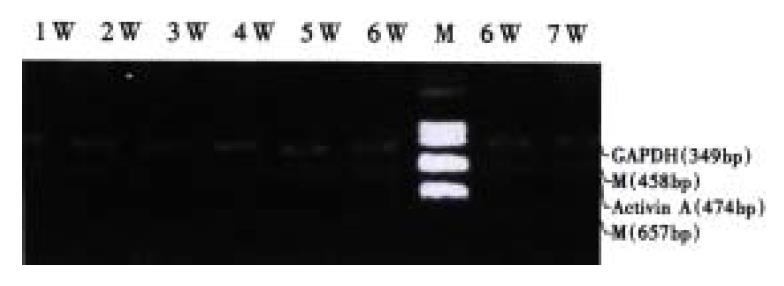
Figure 7 A relative amount of activin βA mRNA were quantified using an image analyzer.
aP < 0.01 vs N; bP < 0.01 vs 4 w; cP < 0.05 vs 4 w. N: normal group, W: week
- Citation: Huang X, Li DG, Wang ZR, Wei HS, Cheng JL, Zhan YT, Zhou X, Xu QF, Li X, Lu HM. Expression changes of activin A in the development of hepatic fibrosis. World J Gastroenterol 2001; 7(1): 37-41
- URL: https://www.wjgnet.com/1007-9327/full/v7/i1/37.htm
- DOI: https://dx.doi.org/10.3748/wjg.v7.i1.37


