Copyright
©The Author(s) 2000.
World J Gastroenterol. Oct 15, 2000; 6(5): 688-692
Published online Oct 15, 2000. doi: 10.3748/wjg.v6.i5.688
Published online Oct 15, 2000. doi: 10.3748/wjg.v6.i5.688
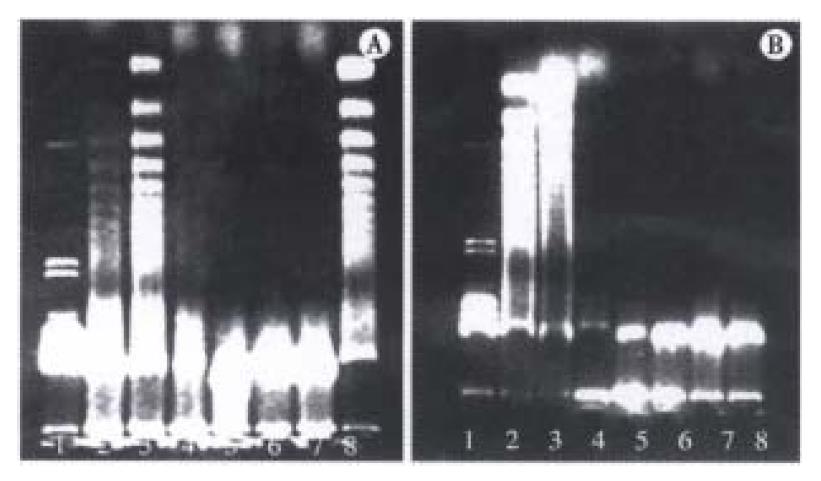
Figure 3 Analysis of DNA ladder from liver cell extract.
A. (1) Marker (λ DNA/Hind III); (2) GalN/ET 9 h; (3) GalN/ET 6 h; (4) GalN/ET 3.5 h; (5) GalN 6 h; (6) ET 6 h; (7) Normal liver cells; (8) Dexamethasone induced apoptosis of thymus cells. B. (1) Marker (λ DNA/Hind-III); (2) GalN/TNF 9 h; (3) GalN/TNF 6 h; (4) GalN/TNF 3.5 h; (5) GalN 6 h; (6) TNF 6 h; (7) Normal liver cells; (8) Anti-TNF-α/GalN/ET 9 h.
- Citation: Zang GQ, Zhou XQ, Yu H, Xie Q, Zhao GM, Wang B, Guo Q, Xiang YQ, Liao D. Effect of hepatocyte apoptosis induced by TNF-α on acute severe hepatitis in mouse models. World J Gastroenterol 2000; 6(5): 688-692
- URL: https://www.wjgnet.com/1007-9327/full/v6/i5/688.htm
- DOI: https://dx.doi.org/10.3748/wjg.v6.i5.688


