Copyright
©The Author(s) 2000.
World J Gastroenterol. Aug 15, 2000; 6(4): 546-552
Published online Aug 15, 2000. doi: 10.3748/wjg.v6.i4.546
Published online Aug 15, 2000. doi: 10.3748/wjg.v6.i4.546
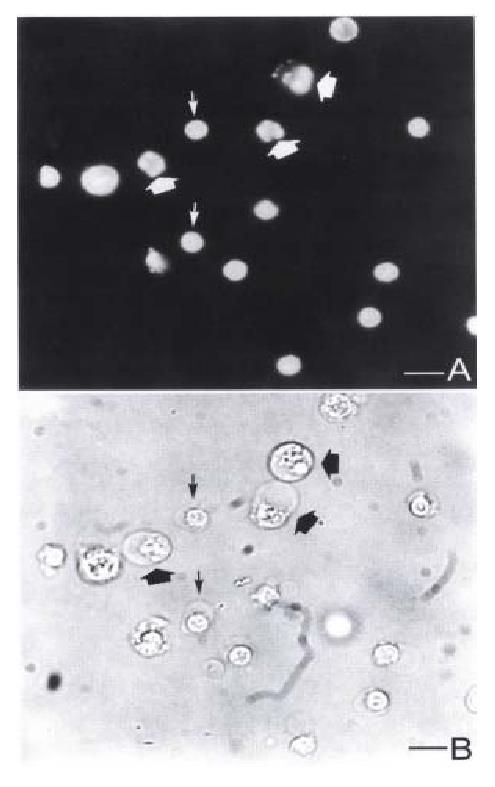
Figure 3 Fluorescence and light micrographs of YAC-1 cells coincubated with pit cells at an E:T ratio of 10:1 for 3 h.
(A) Fluorescence micrograph showing the apoptotic YAC-1 cells with fragmented nuclei (thick arrows) and pit cells ( thin arrows). Light micrograph shows the same field as (A). Bar = 5 μm.
- Citation: Luo DZ, Vermijlen D, Ahishali B, Triantis V, Vanderkerken K, Kuppen PJ, Wisse E. Participation of CD45, NKR-P1A and ANK61 antigen in rat hepatic NK cell (pit cell)-mediated target cell cytotoxicity. World J Gastroenterol 2000; 6(4): 546-552
- URL: https://www.wjgnet.com/1007-9327/full/v6/i4/546.htm
- DOI: https://dx.doi.org/10.3748/wjg.v6.i4.546


