Copyright
©The Author(s) 2000.
World J Gastroenterol. Jun 15, 2000; 6(3): 330-334
Published online Jun 15, 2000. doi: 10.3748/wjg.v6.i3.330
Published online Jun 15, 2000. doi: 10.3748/wjg.v6.i3.330
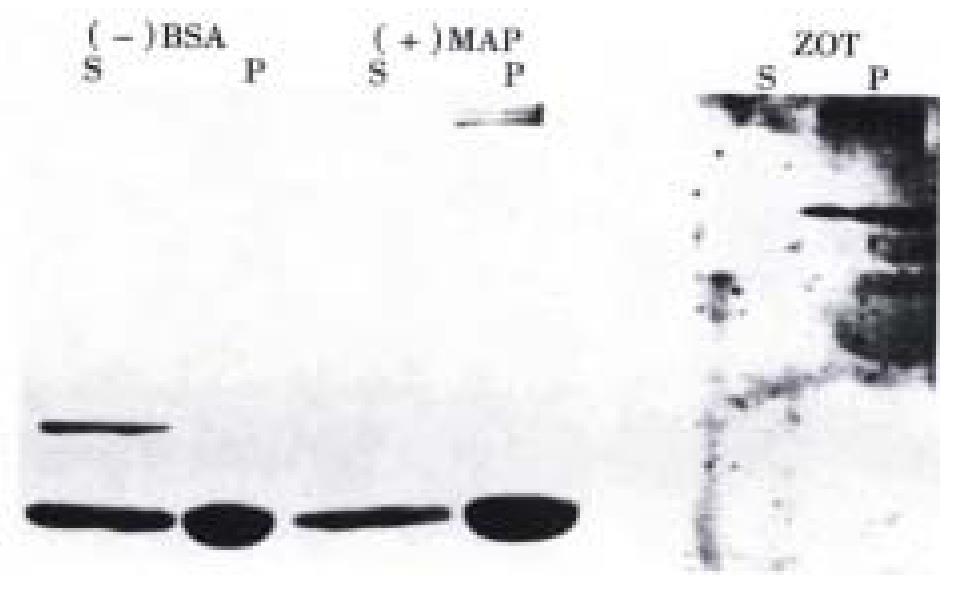
Figure 3 Microtubule binding assay.
BSA (negative control) and MAP2 (positive control) were visualized by Coomassie staning (left panel) while Zot was visualized by immunoblotting (right panel). The bottom protein bands in the left panel are tubulins. As anticipated, BSA remained in the supernatant (S), while MAP2 was entirely precipitated in the pellet (P). Zot also appeared confined in the pellet, confirming that it bound to MT.
- Citation: Wang WL, Lu RL, DiPierro M, Fasano A. Zonula occludin toxin, a microtubule binding protein. World J Gastroenterol 2000; 6(3): 330-334
- URL: https://www.wjgnet.com/1007-9327/full/v6/i3/330.htm
- DOI: https://dx.doi.org/10.3748/wjg.v6.i3.330


