Copyright
©The Author(s) 2000.
World J Gastroenterol. Feb 15, 2000; 6(1): 1-11
Published online Feb 15, 2000. doi: 10.3748/wjg.v6.i1.1
Published online Feb 15, 2000. doi: 10.3748/wjg.v6.i1.1
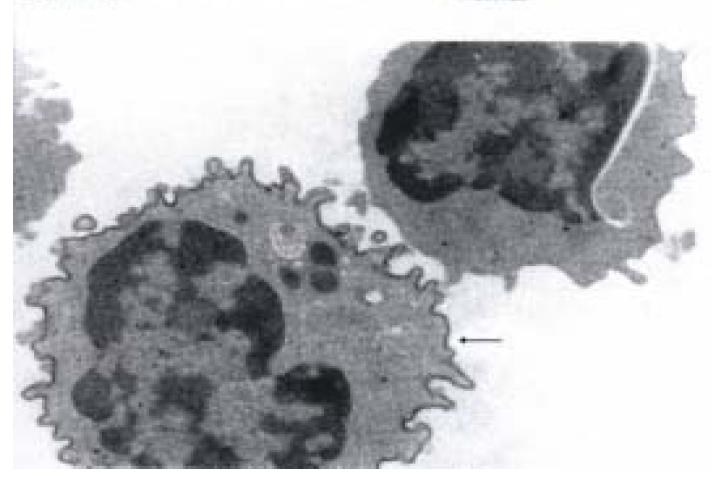
Figure 2 Immuno-transmission electron micrograph showing a 3.
2.3 positive LGL (pit cell) (arrowhead) and a 3.2.3 negative agranular cell. The 3.2.3+ pit cell shows characteristic electron-dense granules in the cyt oplasm and immunoperoxidase reaction product on the surface. Bar = 1 μm.(from Hepatology, 1995; 21: 1690-1694, with permission)
- Citation: Luo DZ, Vermijlen D, Ahishali B, Triantis V, Plakoutsi G, Braet F, Vanderkerken K, Wisse E. On the cell biology of pit cells, the liver-specific NK cells. World J Gastroenterol 2000; 6(1): 1-11
- URL: https://www.wjgnet.com/1007-9327/full/v6/i1/1.htm
- DOI: https://dx.doi.org/10.3748/wjg.v6.i1.1


