Copyright
©The Author(s) 2025.
World J Gastroenterol. Mar 7, 2025; 31(9): 103188
Published online Mar 7, 2025. doi: 10.3748/wjg.v31.i9.103188
Published online Mar 7, 2025. doi: 10.3748/wjg.v31.i9.103188
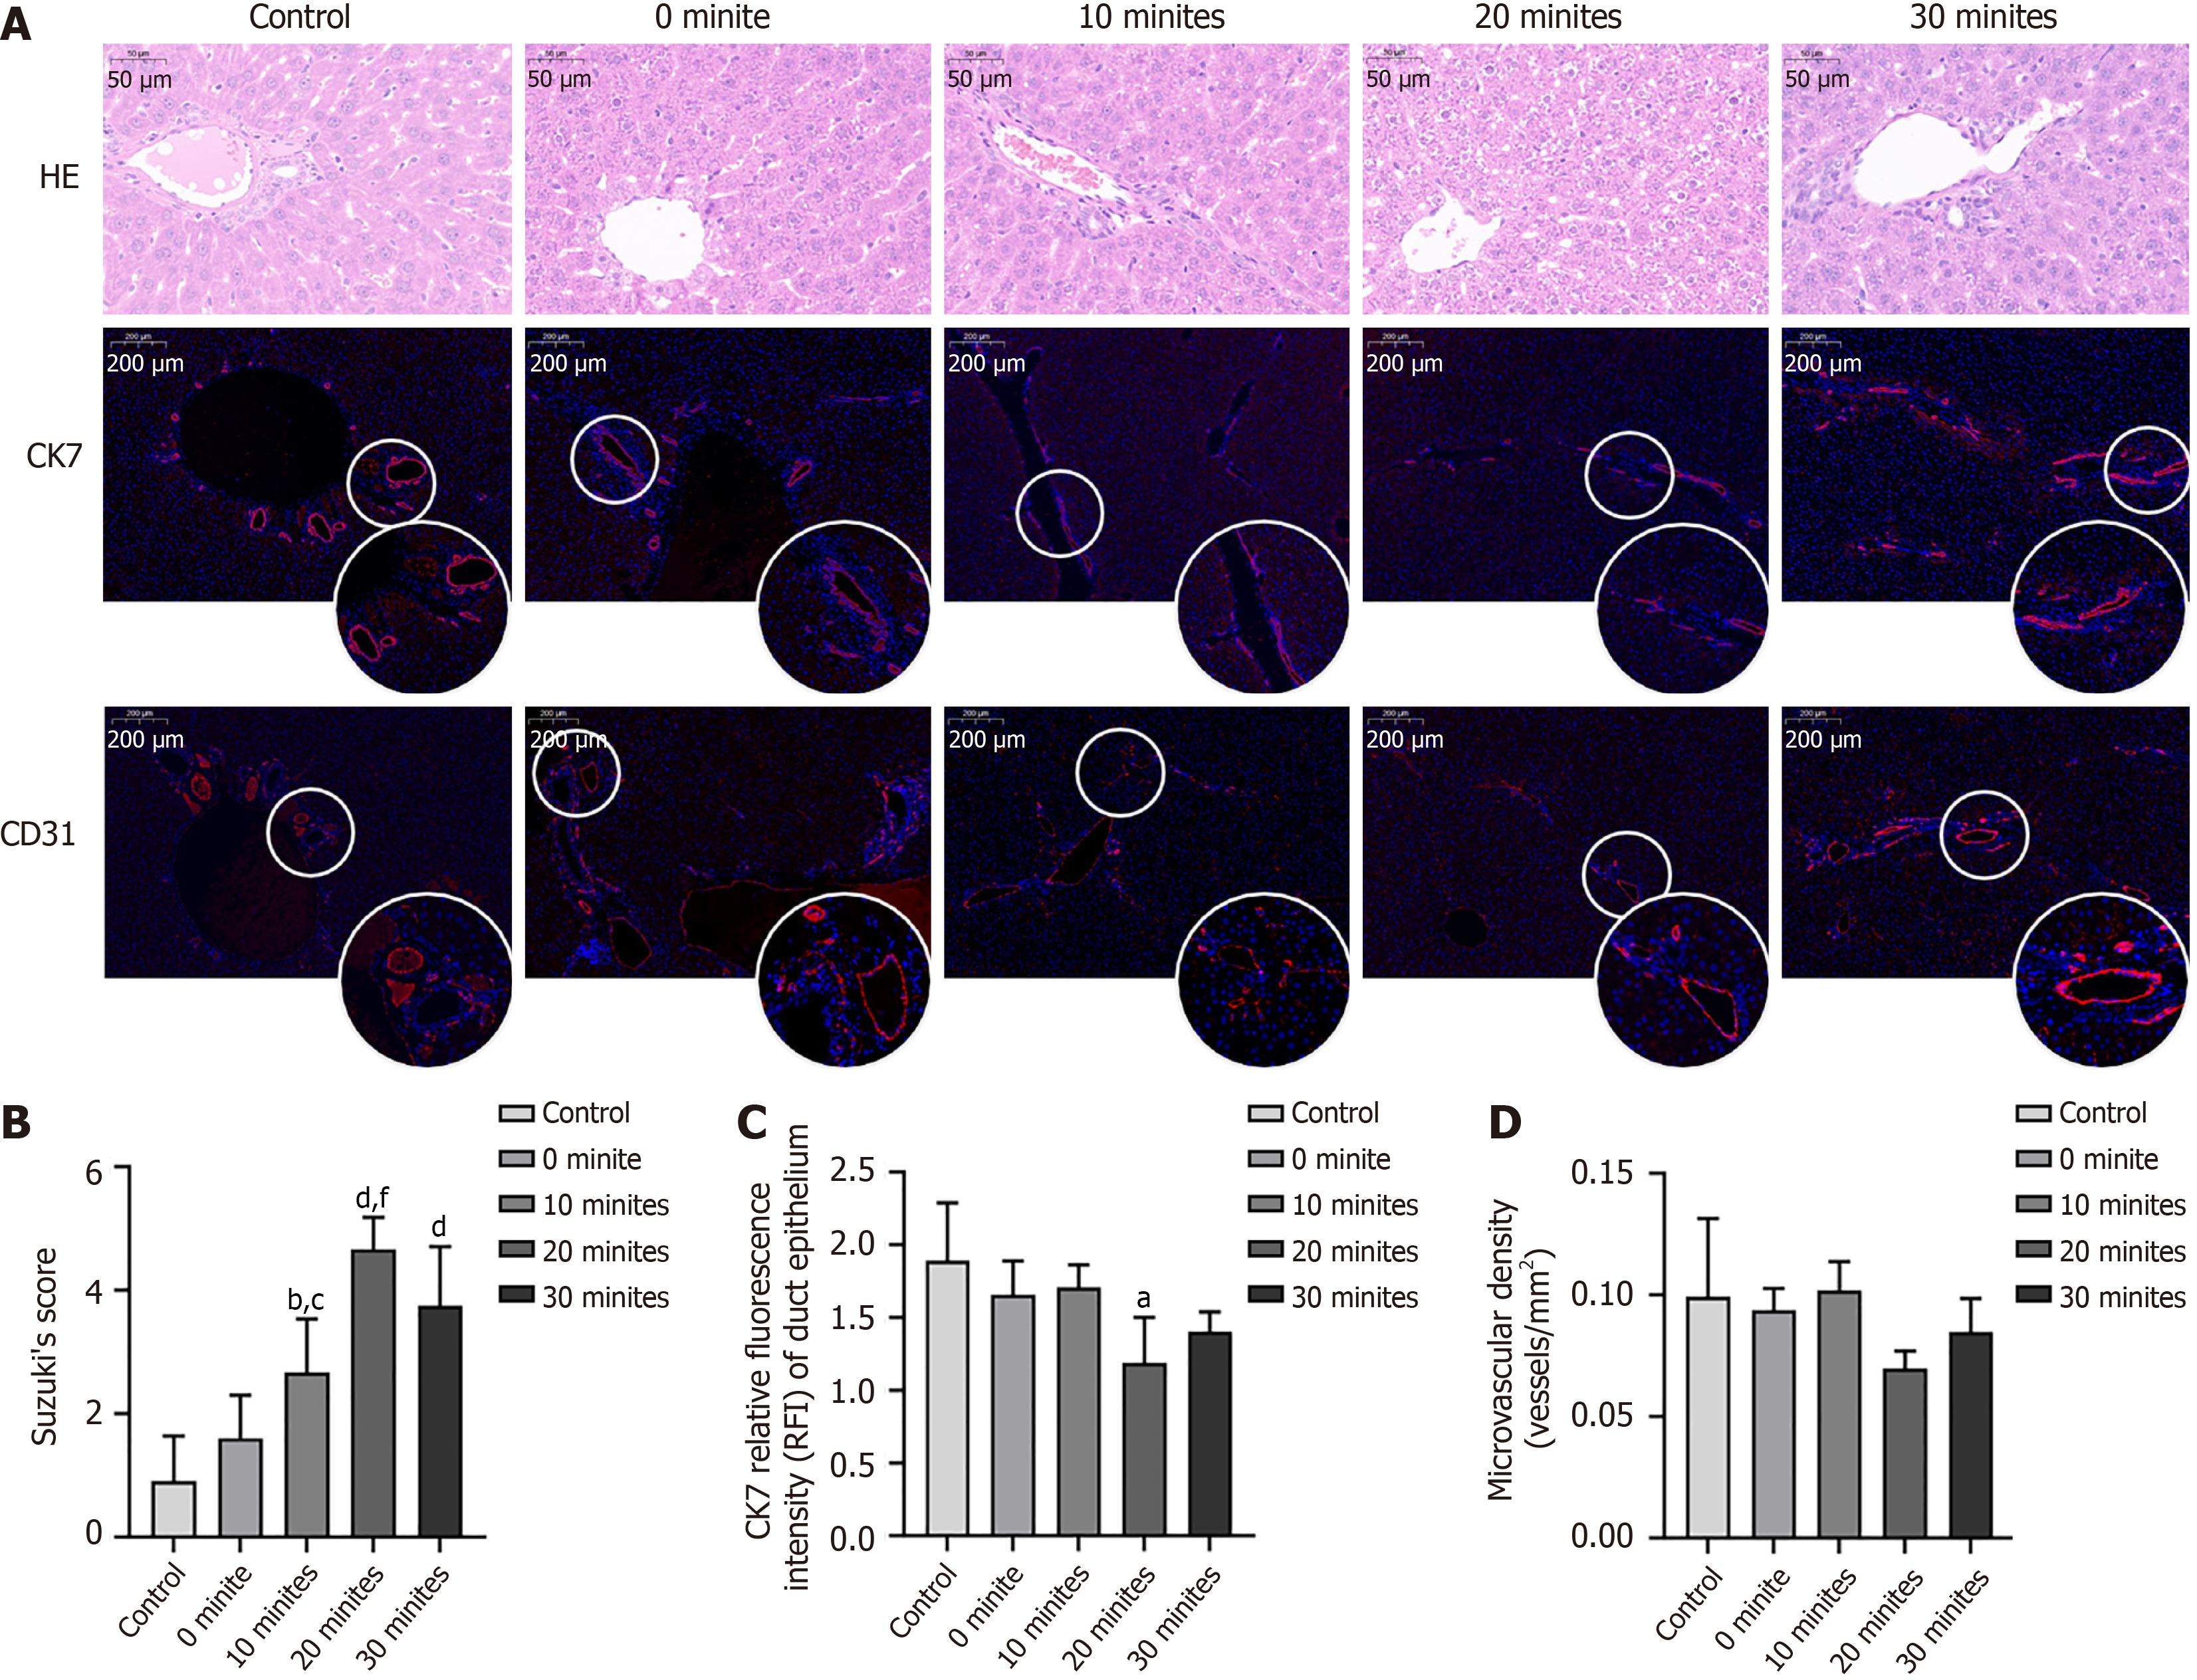
Figure 6 Histological evaluations of the liver grafts.
A: Representative hematoxylin and eosin and immunofluorescence (CK7 and CD31) staining of the liver grafts; B: Suzuki score; C: Bile duct epithelium cell (CK7+) count; D: Microvascular density quantification (CD31+). aP < 0.05 vs control group; bP < 0.01 vs control group; cP < 0.05 vs 0-minute group; dP < 0.01 vs 0-minute group; fP < 0.01 vs 10-minute group.
- Citation: Yu JW, Xiang LB, Dong XJ, Yang CX, Wang L, Liu XY, Song YH, Bai XJ, Xiao JW, Ren L, Xu QH, Yang GH, Lv Y, Lu Q. Shortening the recipient warm ischemia time could be a strategy for expanding the liver donor pool. World J Gastroenterol 2025; 31(9): 103188
- URL: https://www.wjgnet.com/1007-9327/full/v31/i9/103188.htm
- DOI: https://dx.doi.org/10.3748/wjg.v31.i9.103188


