Copyright
©The Author(s) 2025.
World J Gastroenterol. Mar 7, 2025; 31(9): 102714
Published online Mar 7, 2025. doi: 10.3748/wjg.v31.i9.102714
Published online Mar 7, 2025. doi: 10.3748/wjg.v31.i9.102714
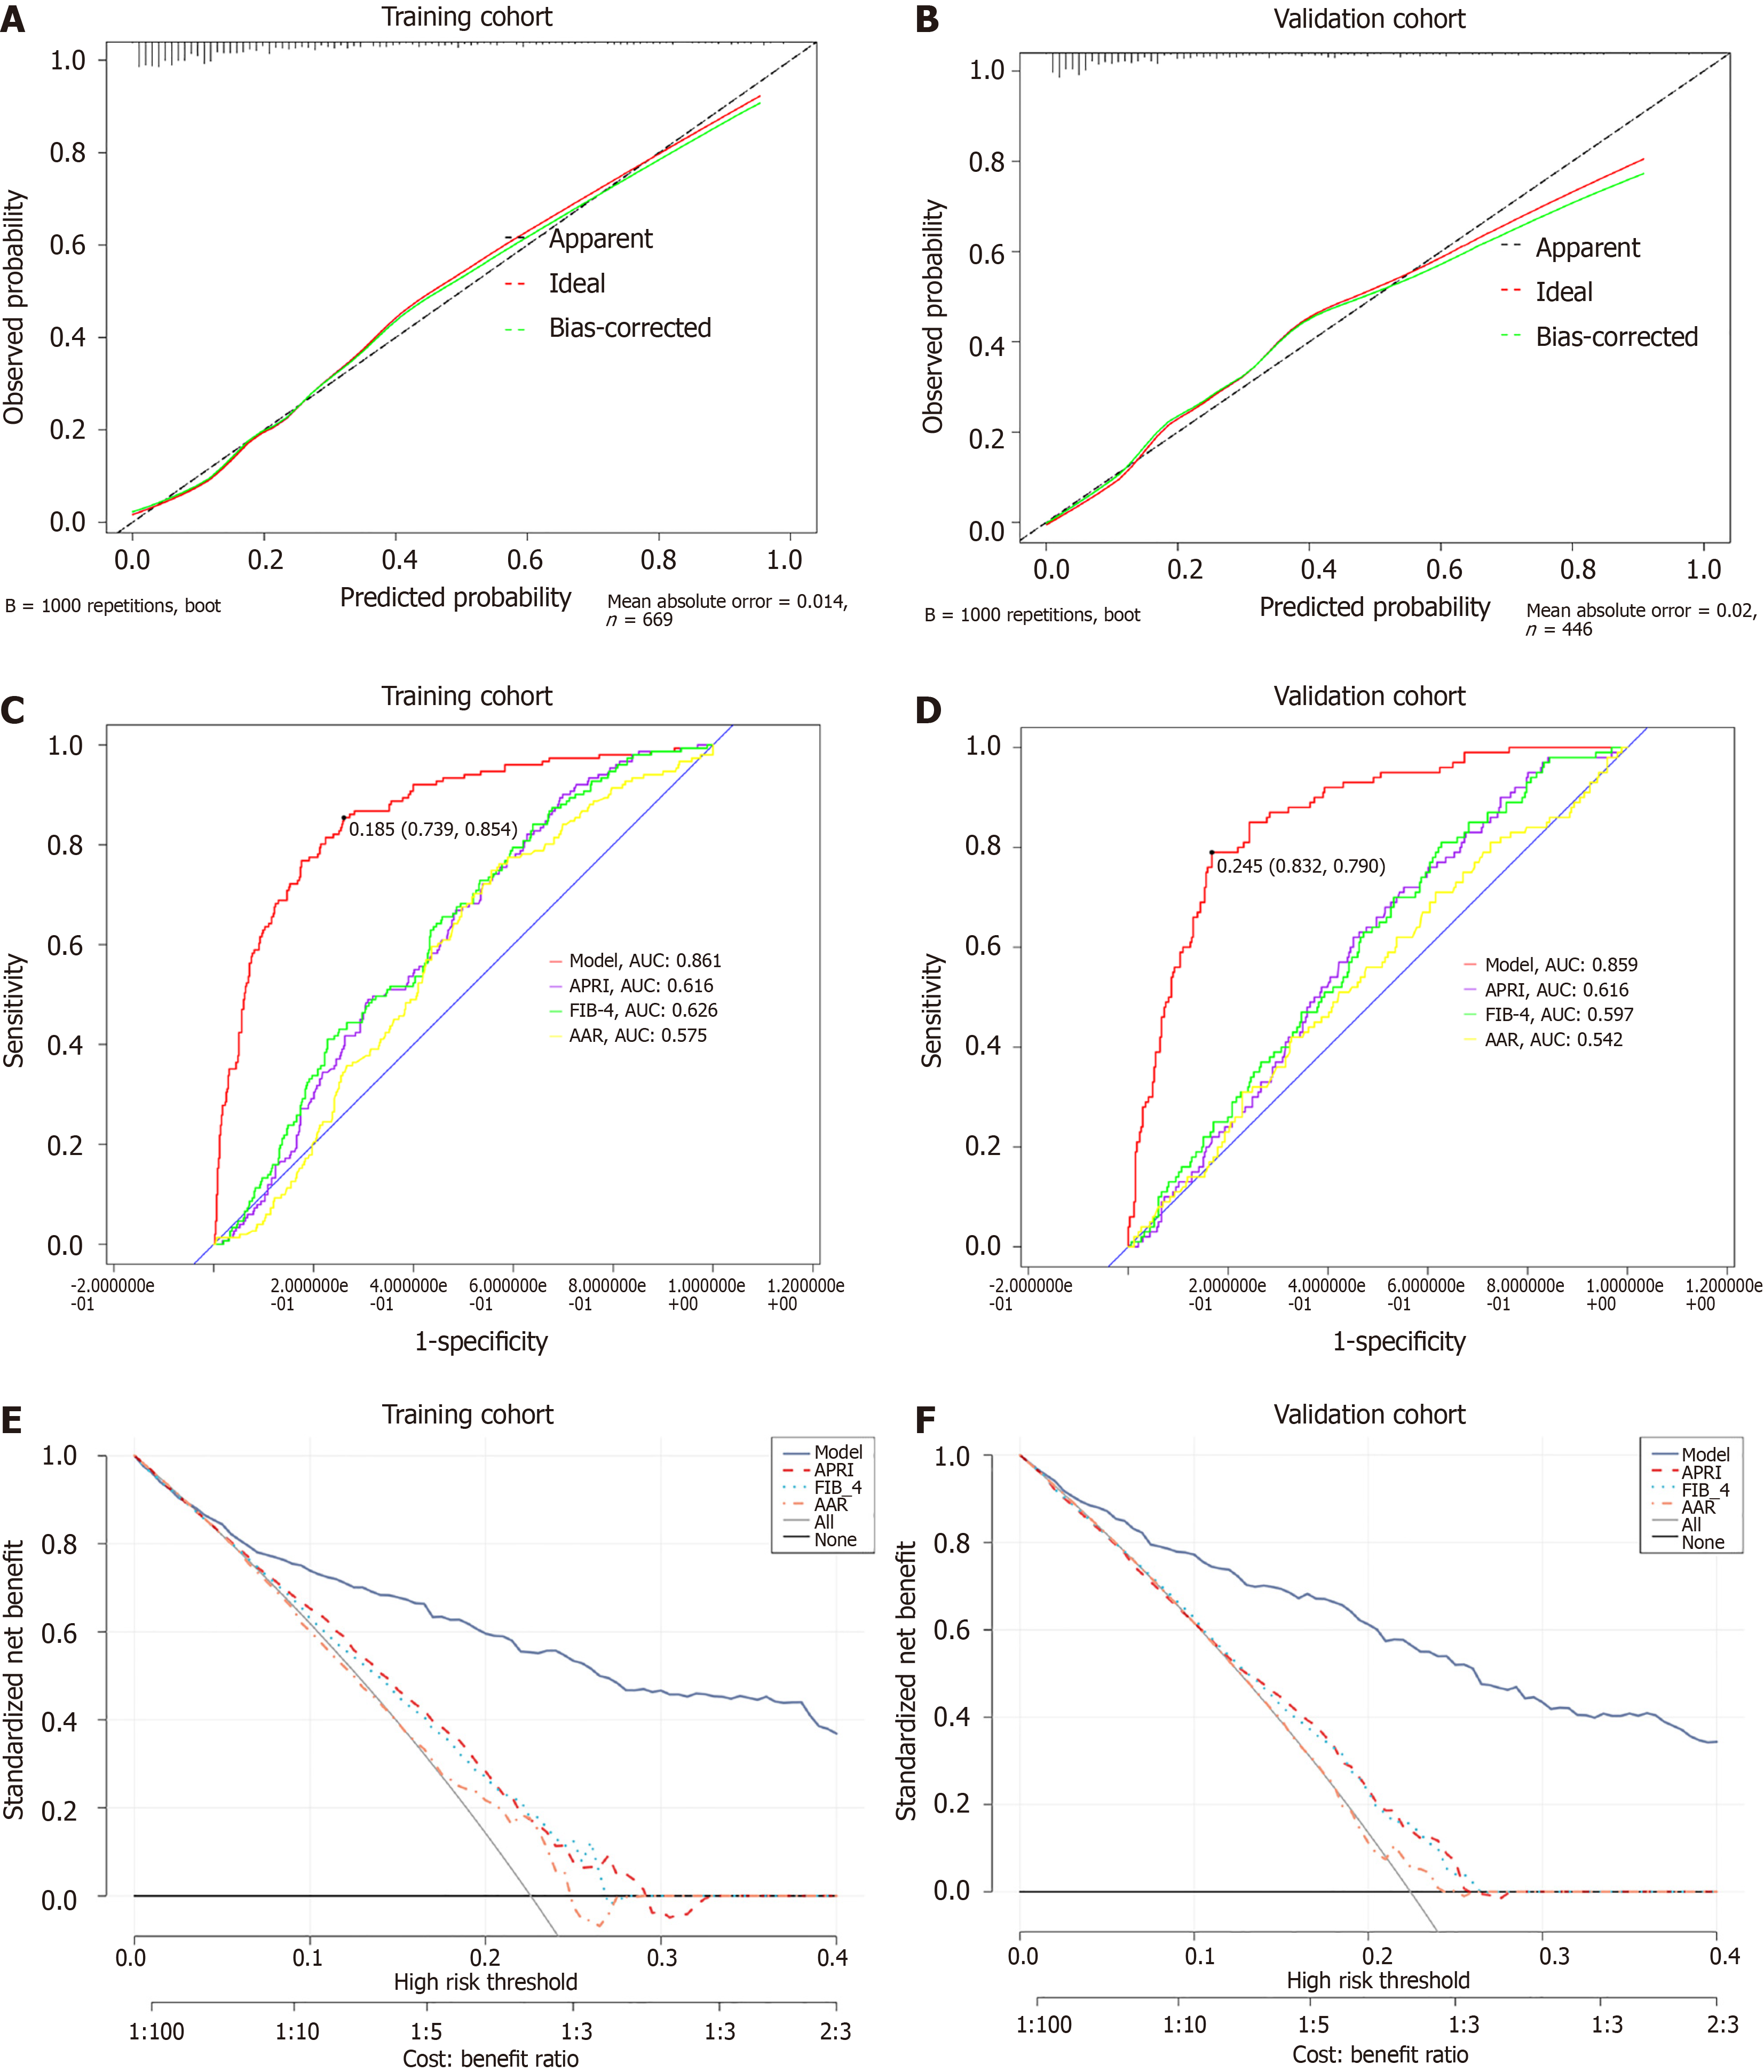
Figure 4 Evaluation and validation of the nomogram model.
A and B: Standard curve of nomogram for the training cohort and validation cohort. Red represents the original calibration curve; green represents the corrected calibration curve; C and D: Receiver operator characteristics curves were plotted in the training and validation cohorts to compare the nomogram with other models (aspartate aminotransferase-to-platelet ratio index, aspartate aminotransferase-to-alanine aminotransferase ratio, and fibrosis index based on 4 factors); E and F: Decision curve analysis curves were plotted in the training cohort and validation cohort to compare the nomogram with other models. The gray oblique line represents the benefit of clinical intervention for all patients with esophagogastric variceal bleeding. The horizontal black line represents the benefit of all esophagogastric variceal bleeding patients without clinical intervention. AUC: Area under the curve; APRI: Aspartate aminotransferase-to-platelet ratio index; FIB-4: Fibrosis index based on 4 factors; AAR: Aspartate aminotransferase-to-alanine aminotransferase ratio.
- Citation: Liang LX, Liang X, Zeng Y, Wang F, Yu XK. Establishment and validation of a nomogram for predicting esophagogastric variceal bleeding in patients with liver cirrhosis. World J Gastroenterol 2025; 31(9): 102714
- URL: https://www.wjgnet.com/1007-9327/full/v31/i9/102714.htm
- DOI: https://dx.doi.org/10.3748/wjg.v31.i9.102714


