Copyright
©The Author(s) 2025.
World J Gastroenterol. Mar 7, 2025; 31(9): 101383
Published online Mar 7, 2025. doi: 10.3748/wjg.v31.i9.101383
Published online Mar 7, 2025. doi: 10.3748/wjg.v31.i9.101383
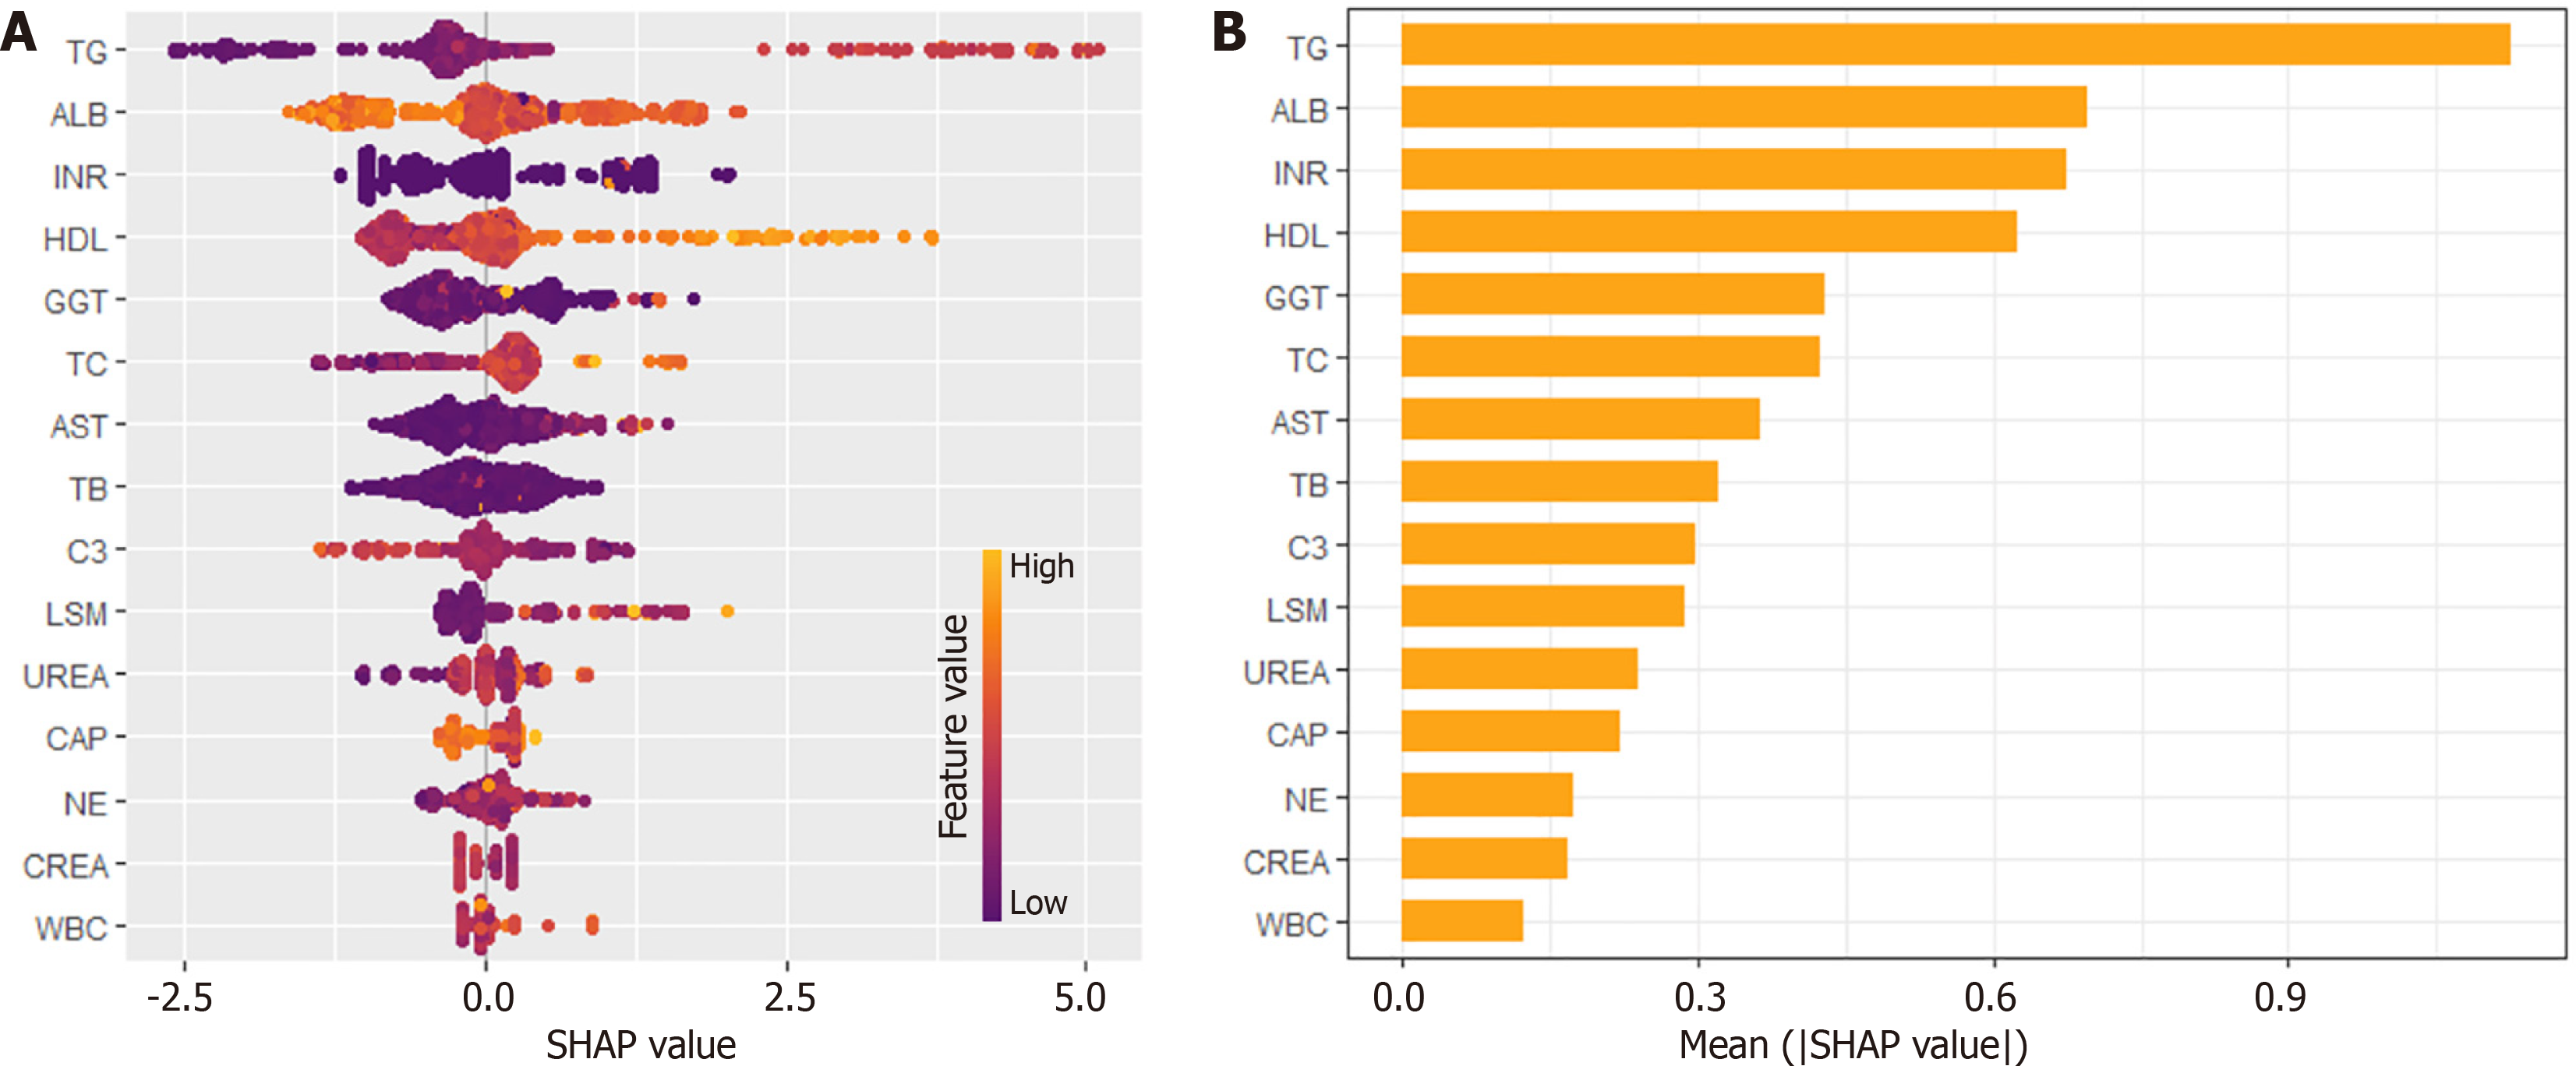
Figure 2 Shapley Additive Explanations plot: The weight of clinical features for diagnosing advanced liver fibrosis through a random forest algorithm.
A: Beeswarm plot; B: Importance bar chart. The plots showed that triglycerides, albumin, international normalized ratio and high-density lipoprotein were the top four indicators. TG: Triglycerides; ALB: Albumin; INR: International normalized ratio; HDL: High-density lipoprotein; GGT: Gamma-glutamyl transferase; AST: Alanine aminotransferase; LSM: Liver stiffness measurement; WBC: White blood cell; CAP: Controlled attenuation parameter; SHAP: Shapley Additive Explanations.
- Citation: Xiong FX, Sun L, Zhang XJ, Chen JL, Zhou Y, Ji XM, Meng PP, Wu T, Wang XB, Hou YX. Machine learning-based models for advanced fibrosis in non-alcoholic steatohepatitis patients: A cohort study. World J Gastroenterol 2025; 31(9): 101383
- URL: https://www.wjgnet.com/1007-9327/full/v31/i9/101383.htm
- DOI: https://dx.doi.org/10.3748/wjg.v31.i9.101383


