Copyright
©The Author(s) 2025.
World J Gastroenterol. Mar 7, 2025; 31(9): 100271
Published online Mar 7, 2025. doi: 10.3748/wjg.v31.i9.100271
Published online Mar 7, 2025. doi: 10.3748/wjg.v31.i9.100271
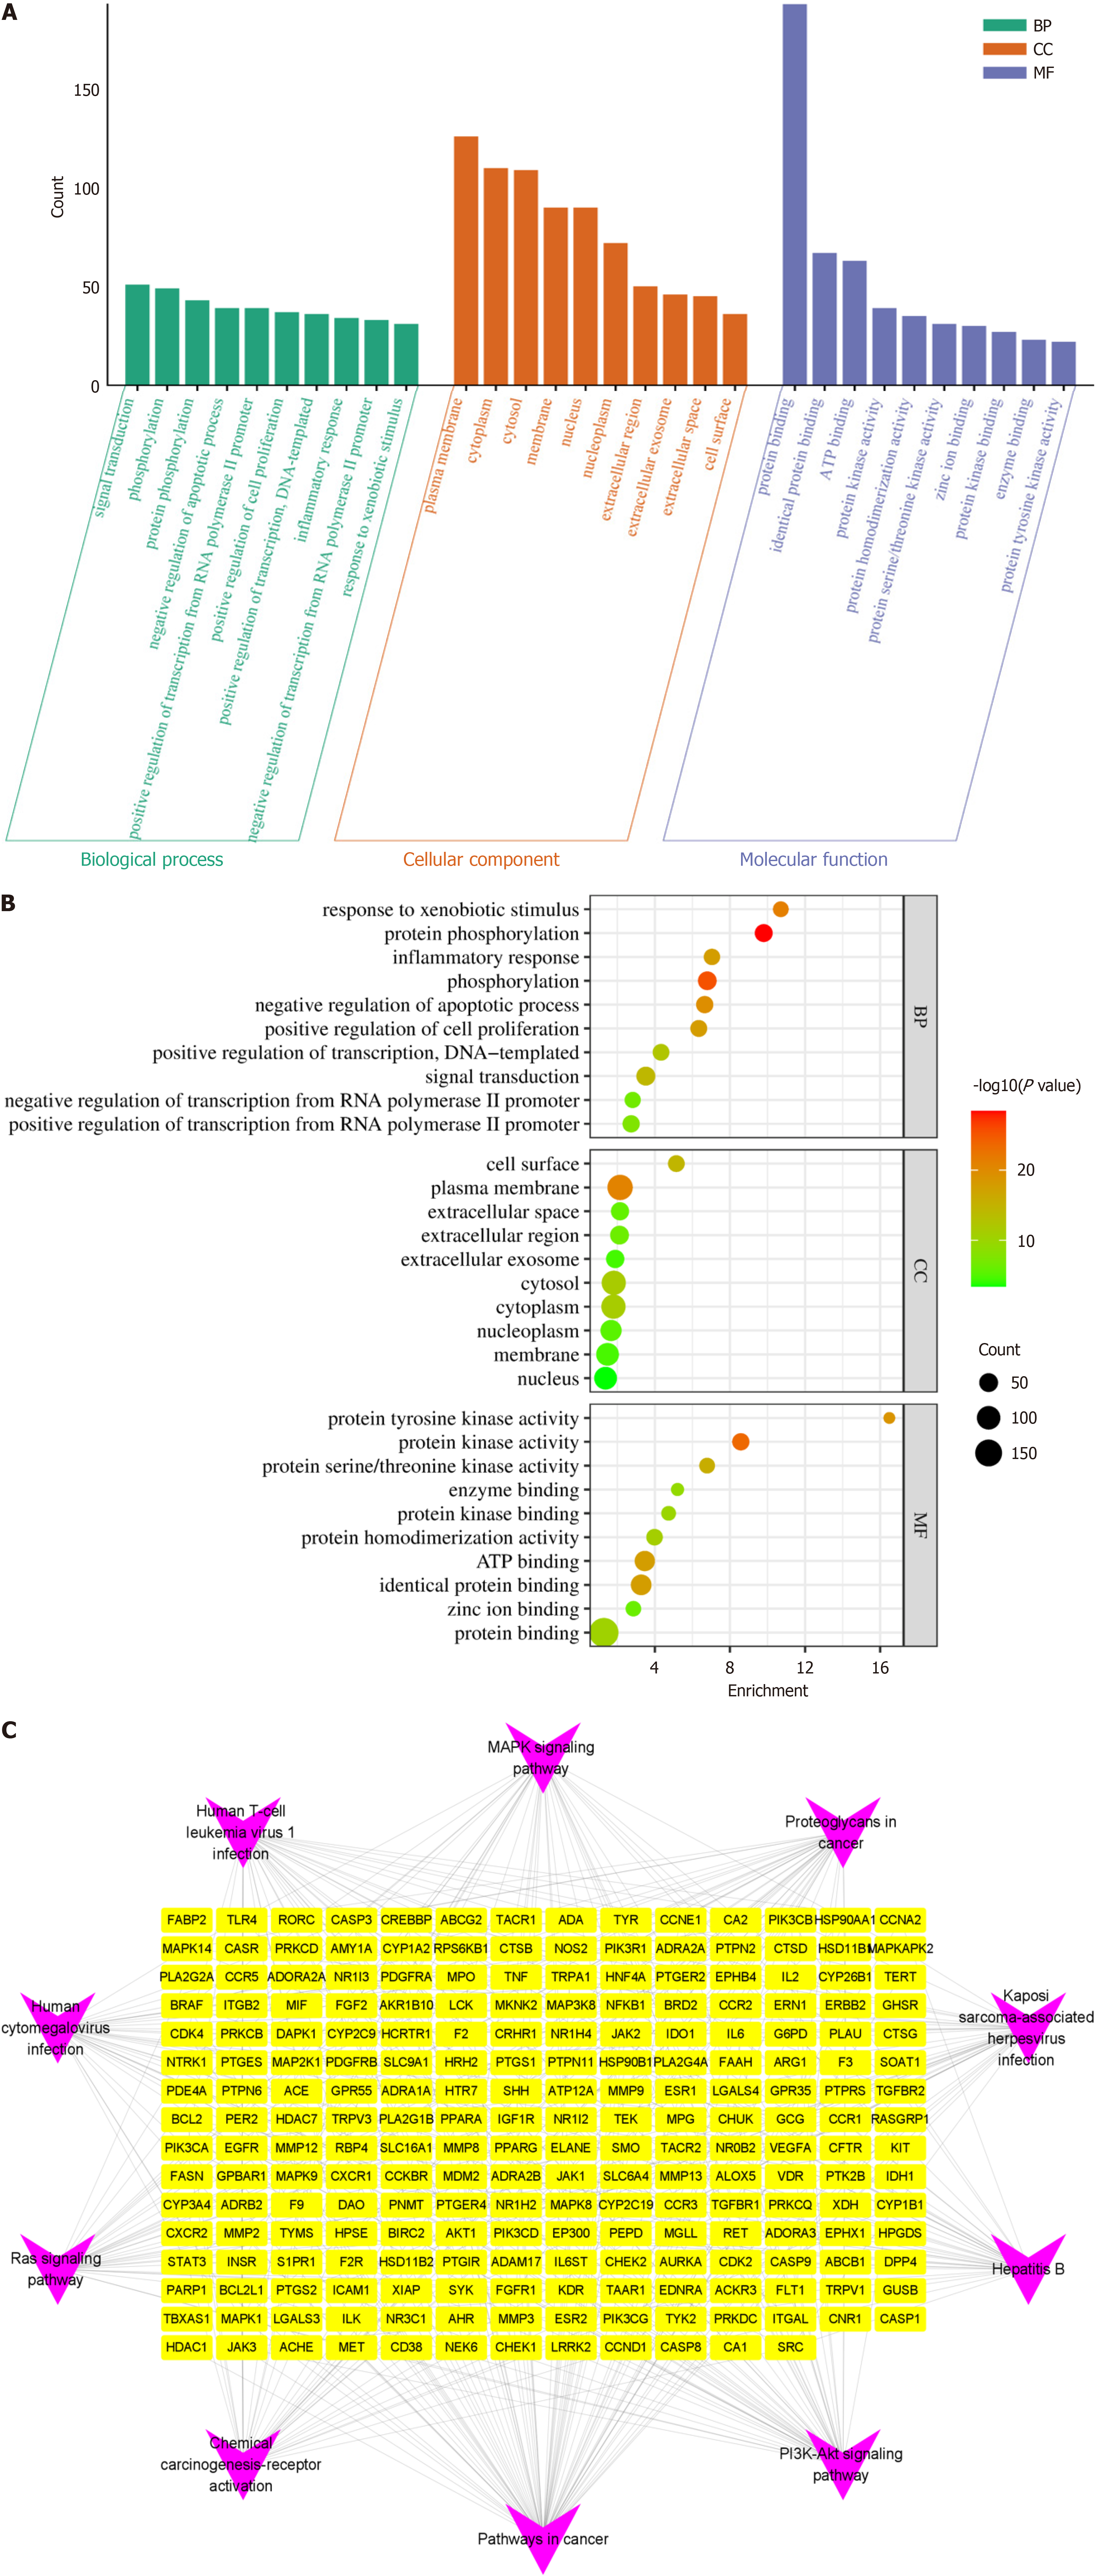
Figure 2 Gene Ontology and Kyoto Encyclopedia of Genes and Genomes enrichment analysis.
A: Histogram of Gene Ontology (GO) enrichment analysis, displaying categories for biological process, cellular component, and molecular function; B: Bubble chart of GO enrichment analysis, where the X-axis represents the enrichment value. The color intensity of the dots indicates the P value (with redder dots indicating lower P values), and the size of the dots reflects the number of counts; C: Network analysis of the Kyoto Encyclopedia of Genes and Genomes (KEGG) pathways. Purple nodes represent the top 10 KEGG pathways, and the yellow nodes represent the intersection genes between Panax ginseng and ulcerative colitis. BP: Biological process; CC: Cellular component; MF: Molecular function.
- Citation: Qin Y, Zhang RY, Zhang Y, Zhao YQ, Hao HF, Wang JP. Network pharmacology and in vivo study: Unraveling the therapeutic mechanisms of Panax ginseng in potentially treating ulcerative colitis. World J Gastroenterol 2025; 31(9): 100271
- URL: https://www.wjgnet.com/1007-9327/full/v31/i9/100271.htm
- DOI: https://dx.doi.org/10.3748/wjg.v31.i9.100271


