Copyright
©The Author(s) 2025.
World J Gastroenterol. Feb 28, 2025; 31(8): 99036
Published online Feb 28, 2025. doi: 10.3748/wjg.v31.i8.99036
Published online Feb 28, 2025. doi: 10.3748/wjg.v31.i8.99036
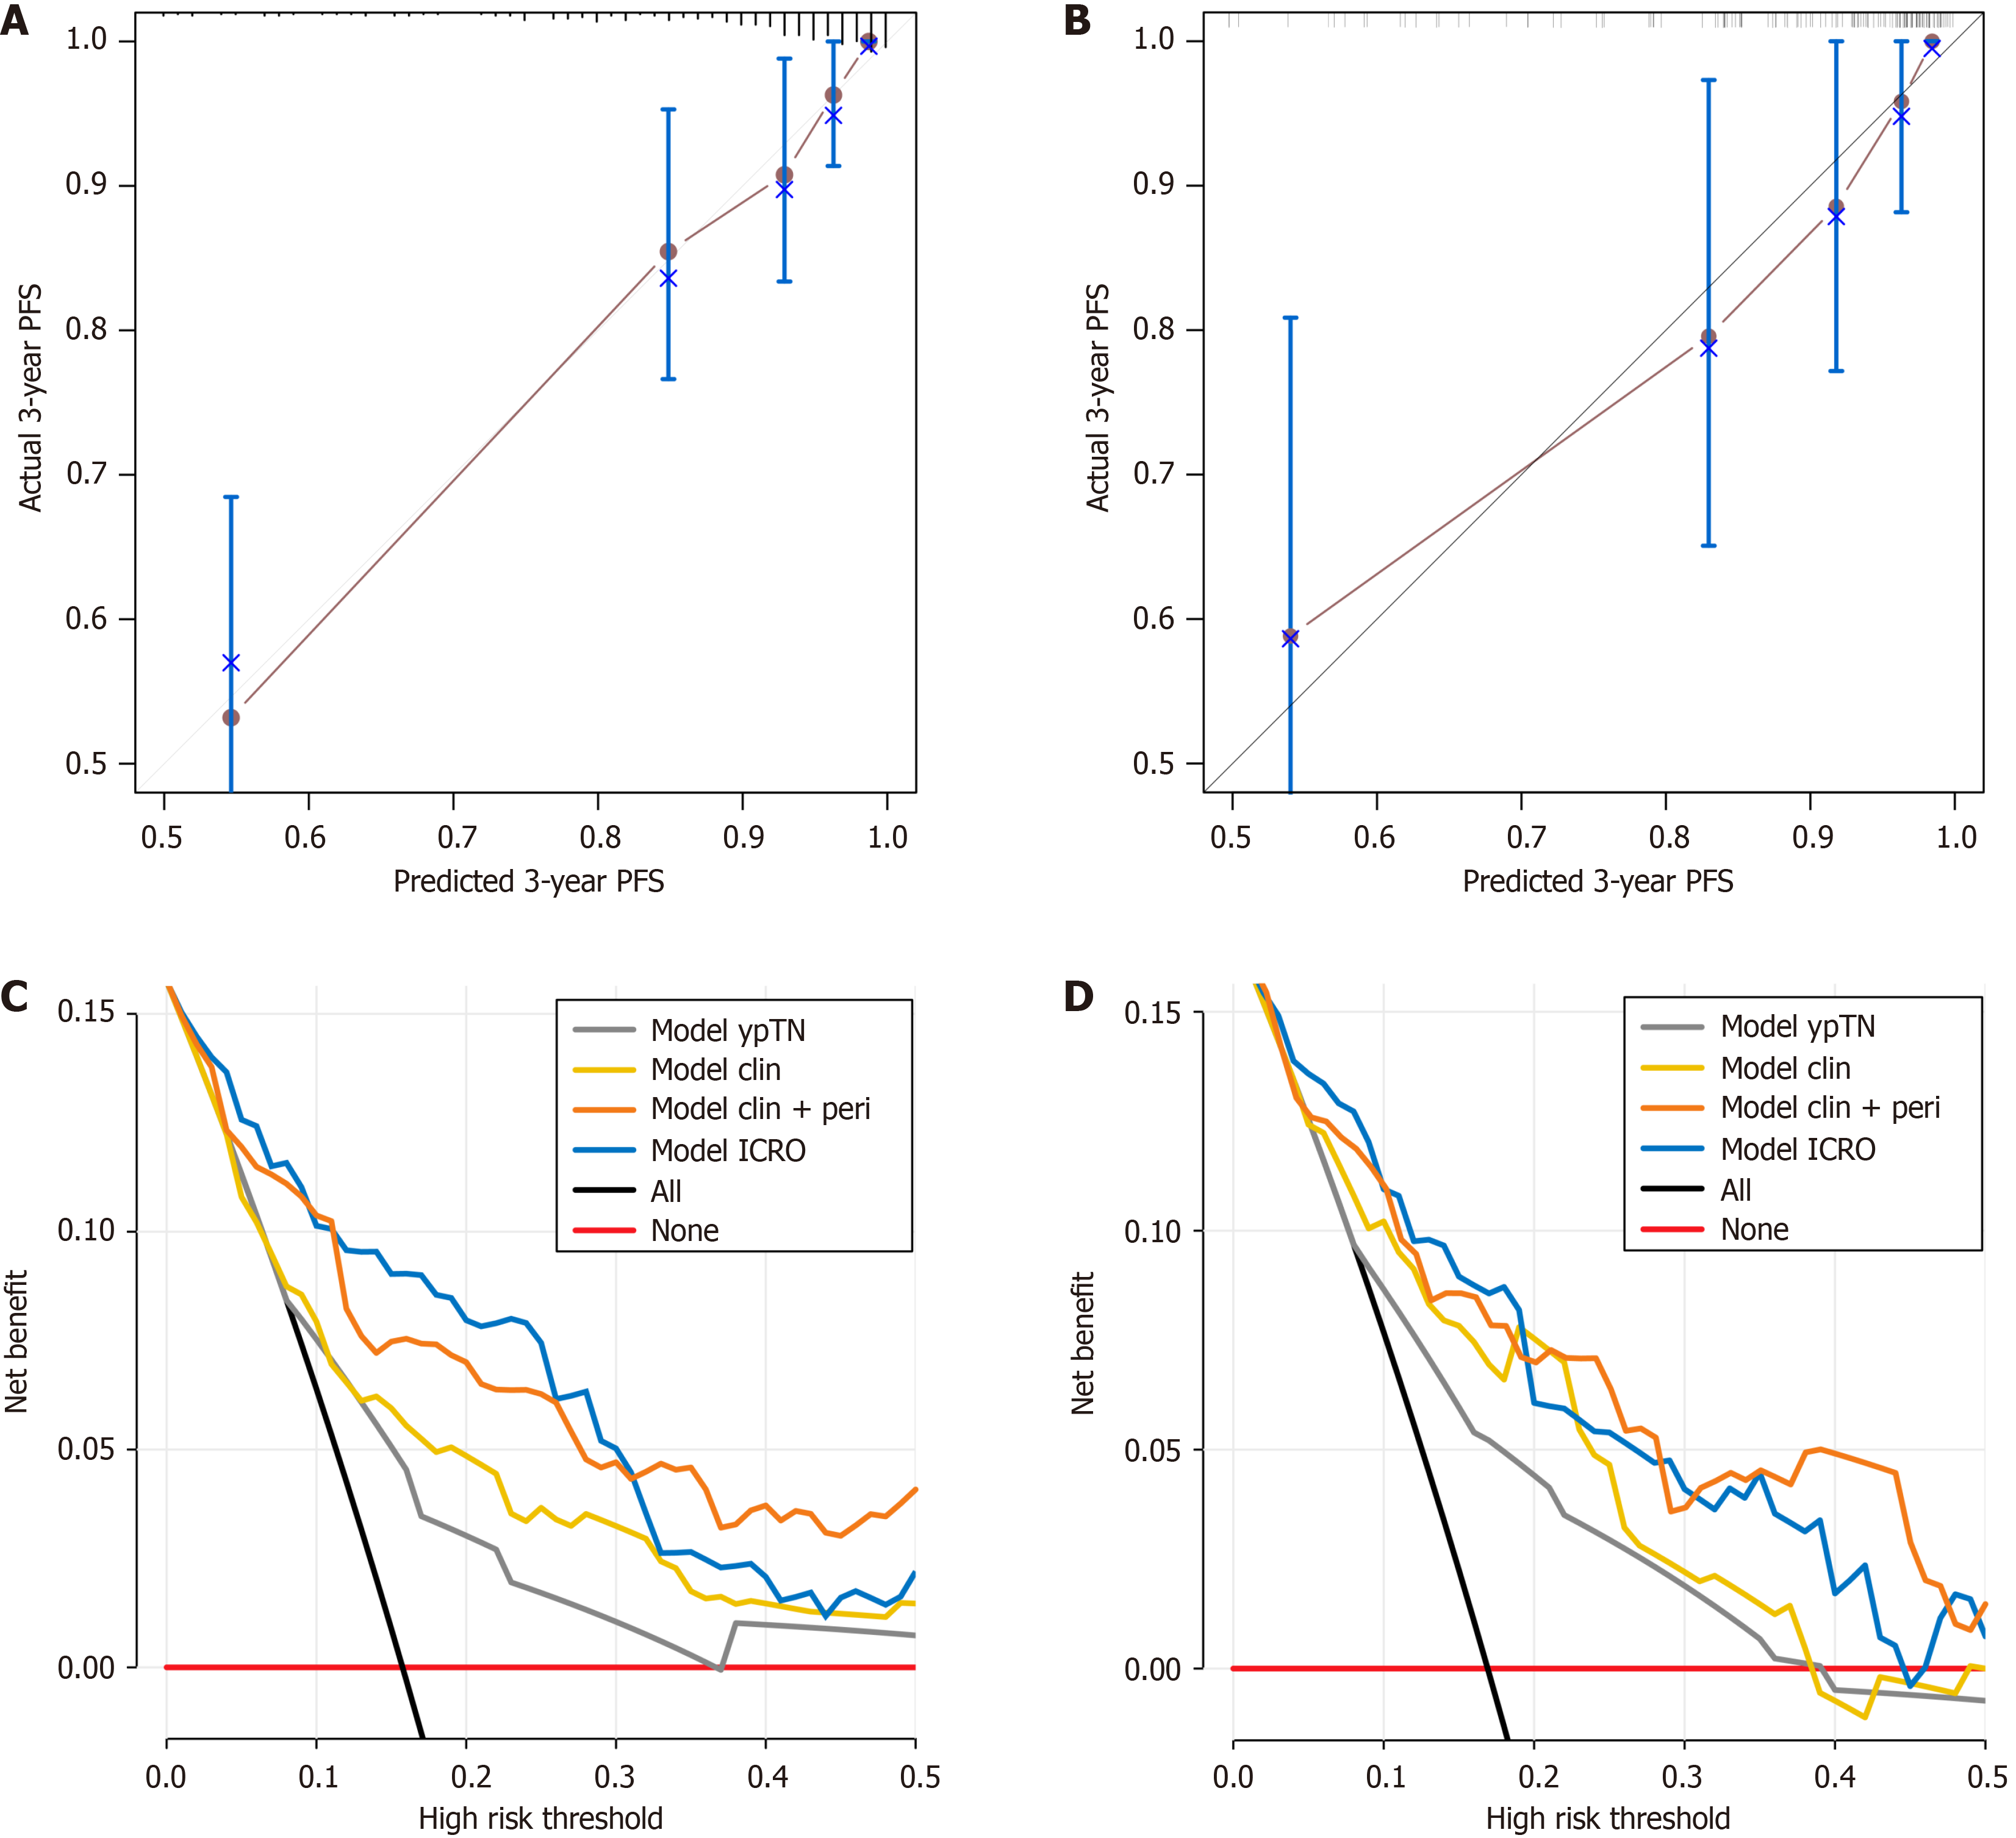
Figure 4 Calibration and decision curves of the prognostic models.
Calibration curves of integrated clinical-radiological-omics model (ModelICRO) showing a robust calibration between the predicted 3-year progression-free survival (X-axis) and the actual 3-year progression-free survival (Y-axis). A: In the training; B: Validation sets; Decision curves of model based on the pathological T stage and pathological N stage (grey line), model based on body mass index, pathological N stage, tumor regression grade, and mesorectal fascia status (Modelclin) (yellow line), Modelclin+peri (orange line), and ModelICRO (blue line) showing the net benefit across a range of threshold probabilities; C: In the training; D: Validation sets. ModelICRO shows the highest net benefit across most threshold probabilities. ICRO: Integrated clinical-radiological-omics; Clin: Clinicoradiological; PFS: Progression-free survival; Intra: Intratumoral; peri: Peritumoral; ypTN: Pathological T and N stages after neoadjuvant chemoradiotherapy.
- Citation: Liang ZY, Yu ML, Yang H, Li HJ, Xie H, Cui CY, Zhang WJ, Luo C, Cai PQ, Lin XF, Liu KF, Xiong L, Liu LZ, Chen BY. Beyond the tumor region: Peritumoral radiomics enhances prognostic accuracy in locally advanced rectal cancer. World J Gastroenterol 2025; 31(8): 99036
- URL: https://www.wjgnet.com/1007-9327/full/v31/i8/99036.htm
- DOI: https://dx.doi.org/10.3748/wjg.v31.i8.99036


