Copyright
©The Author(s) 2025.
World J Gastroenterol. Feb 28, 2025; 31(8): 99036
Published online Feb 28, 2025. doi: 10.3748/wjg.v31.i8.99036
Published online Feb 28, 2025. doi: 10.3748/wjg.v31.i8.99036
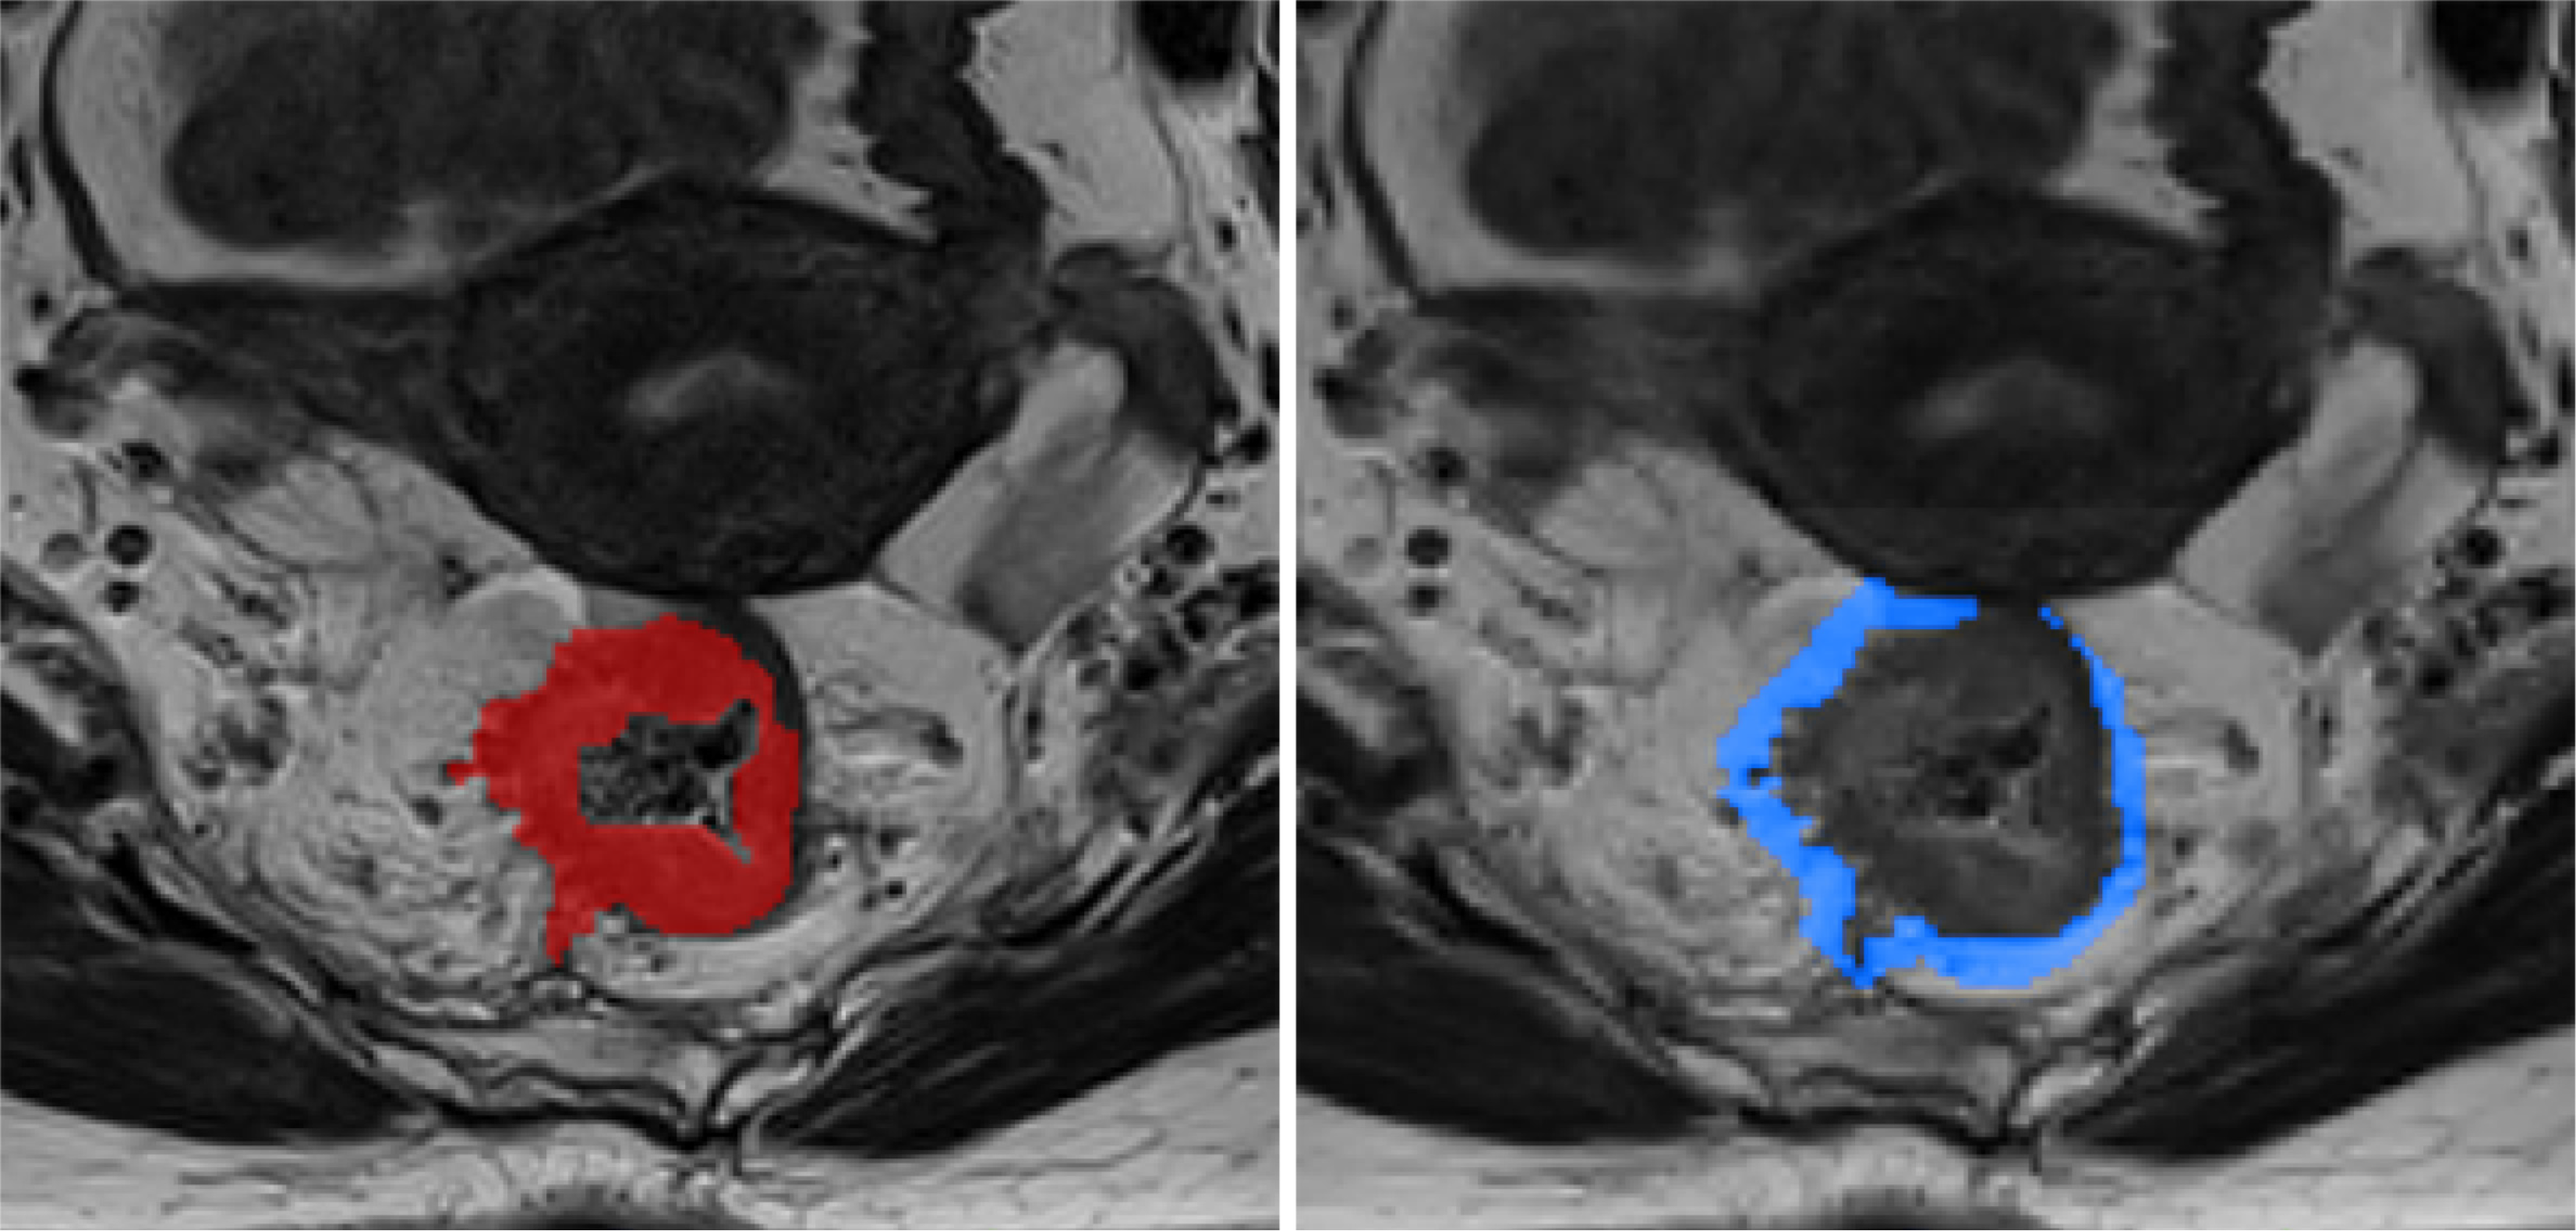
Figure 3 Example of intratumoral and peritumoral segmentation.
The intratumoral region of interest (ROI) (left, red) is manually delineated, while the peritumoral ROI (right, blue) is automatically generated. On axial high-resolution small-field-of-view T2-weighted imaging slices, the intratumoral ROI is meticulously delineated to cover the entire rectal tumor, whereas the tube ROI is drawn to encompass both the rectal tube area and tumor. Subsequently, the peritumoral ROI, representing the area surrounding the tumor, is automatically generated by the overlapping region resulting from a 5-mm dilation of both the intratumoral ROI and tube ROI.
- Citation: Liang ZY, Yu ML, Yang H, Li HJ, Xie H, Cui CY, Zhang WJ, Luo C, Cai PQ, Lin XF, Liu KF, Xiong L, Liu LZ, Chen BY. Beyond the tumor region: Peritumoral radiomics enhances prognostic accuracy in locally advanced rectal cancer. World J Gastroenterol 2025; 31(8): 99036
- URL: https://www.wjgnet.com/1007-9327/full/v31/i8/99036.htm
- DOI: https://dx.doi.org/10.3748/wjg.v31.i8.99036


