Copyright
©The Author(s) 2025.
World J Gastroenterol. Feb 28, 2025; 31(8): 102347
Published online Feb 28, 2025. doi: 10.3748/wjg.v31.i8.102347
Published online Feb 28, 2025. doi: 10.3748/wjg.v31.i8.102347
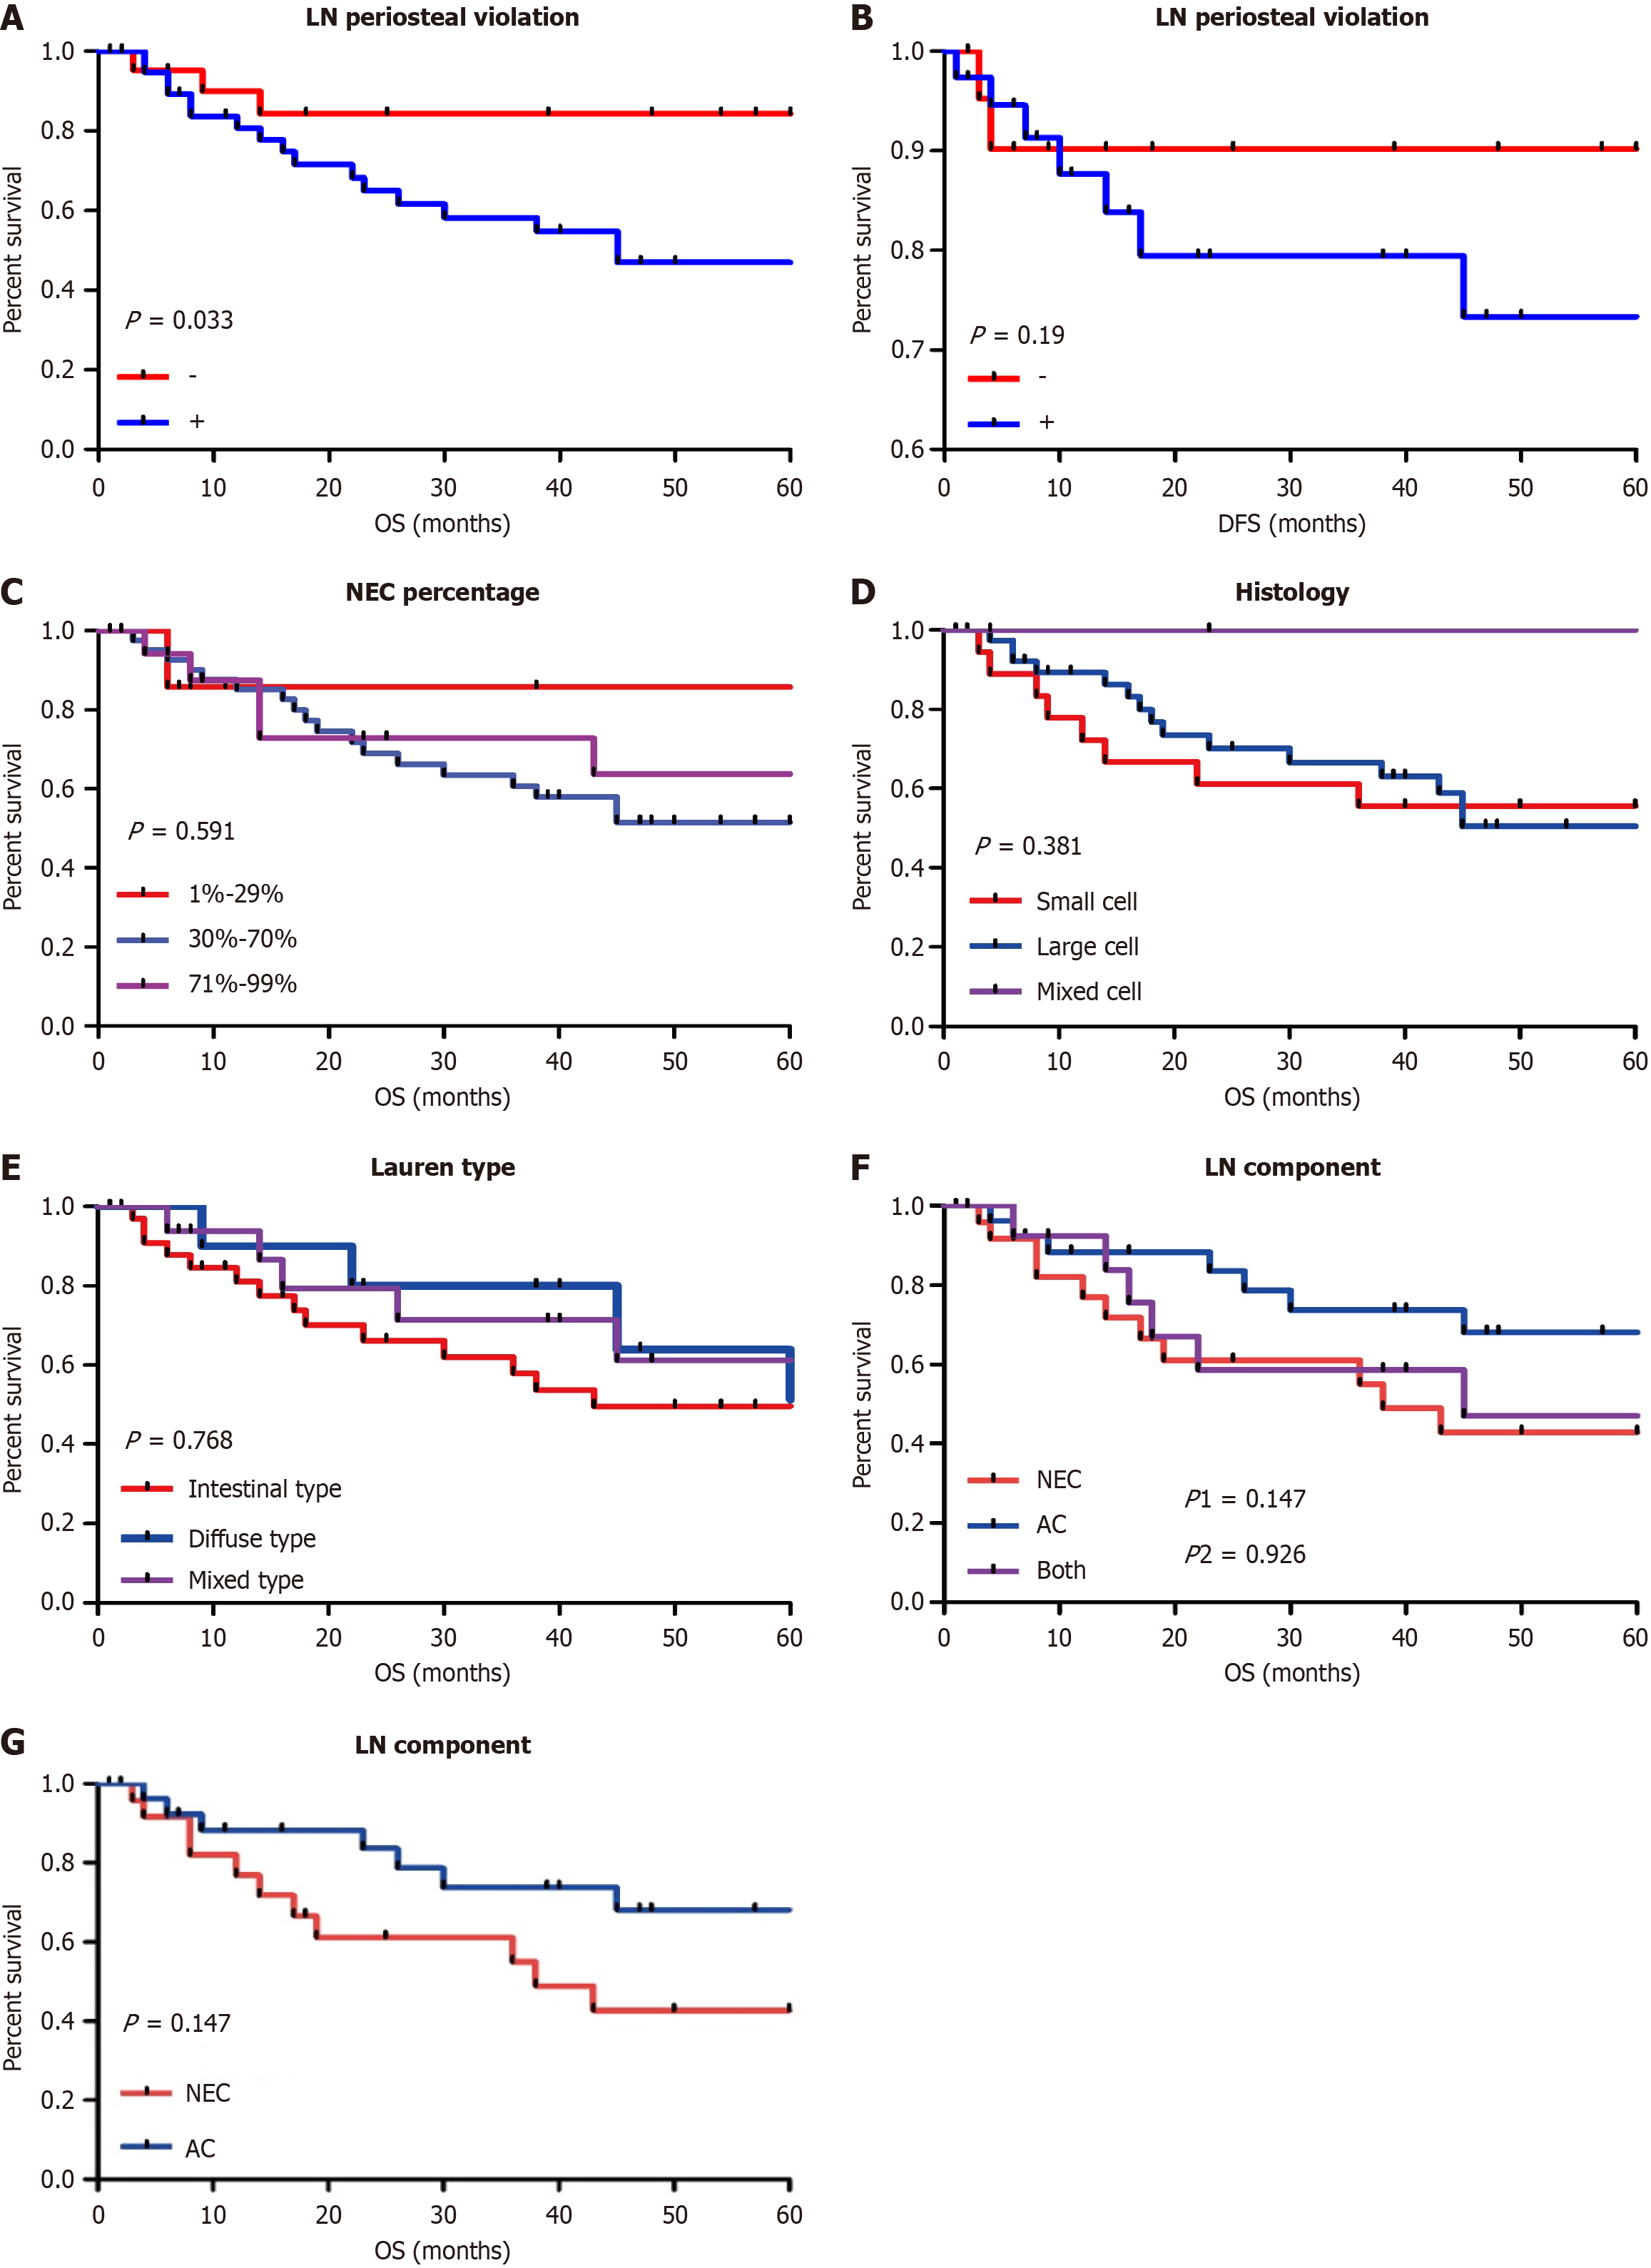
Figure 3 Kaplan-Meier curves.
A: Kaplan-Meier curves for lymph node periosteal violation and overall survival; B: Kaplan-Meier curves for lymph node periosteal violation and disease-free survival; Kaplan-Meier cumulative survival curves according to overall tumour survival of neuroendocrine carcinoma%: C: Primary tumour; D: Histological type; E: Lauren type; F: Comparison of overall survival in three patterns of lymph node metastasis; G: Comparison of overall survival in lymph node metastasis comprising “pure” adenocarcinoma and “pure” neuroendocrine carcinoma. OS: Overall survival; DFS: Disease-free survival; NEC: Neuroendocrine carcinoma; AC: Adenocarcinoma; LN: Lymph node.
- Citation: Zhou K, Li ZW, Wu Y, Wang ZJ, Wang LQ, Zhou LX, Jia L, Ji K, Yang XS, Zhang J, Wu XJ, Wang AQ, Bu ZD. Lymph node metastatic patterns of gastric carcinoma with a combination of adenocarcinoma and neuroendocrine carcinoma components. World J Gastroenterol 2025; 31(8): 102347
- URL: https://www.wjgnet.com/1007-9327/full/v31/i8/102347.htm
- DOI: https://dx.doi.org/10.3748/wjg.v31.i8.102347


