Copyright
©The Author(s) 2025.
World J Gastroenterol. Feb 21, 2025; 31(7): 101104
Published online Feb 21, 2025. doi: 10.3748/wjg.v31.i7.101104
Published online Feb 21, 2025. doi: 10.3748/wjg.v31.i7.101104
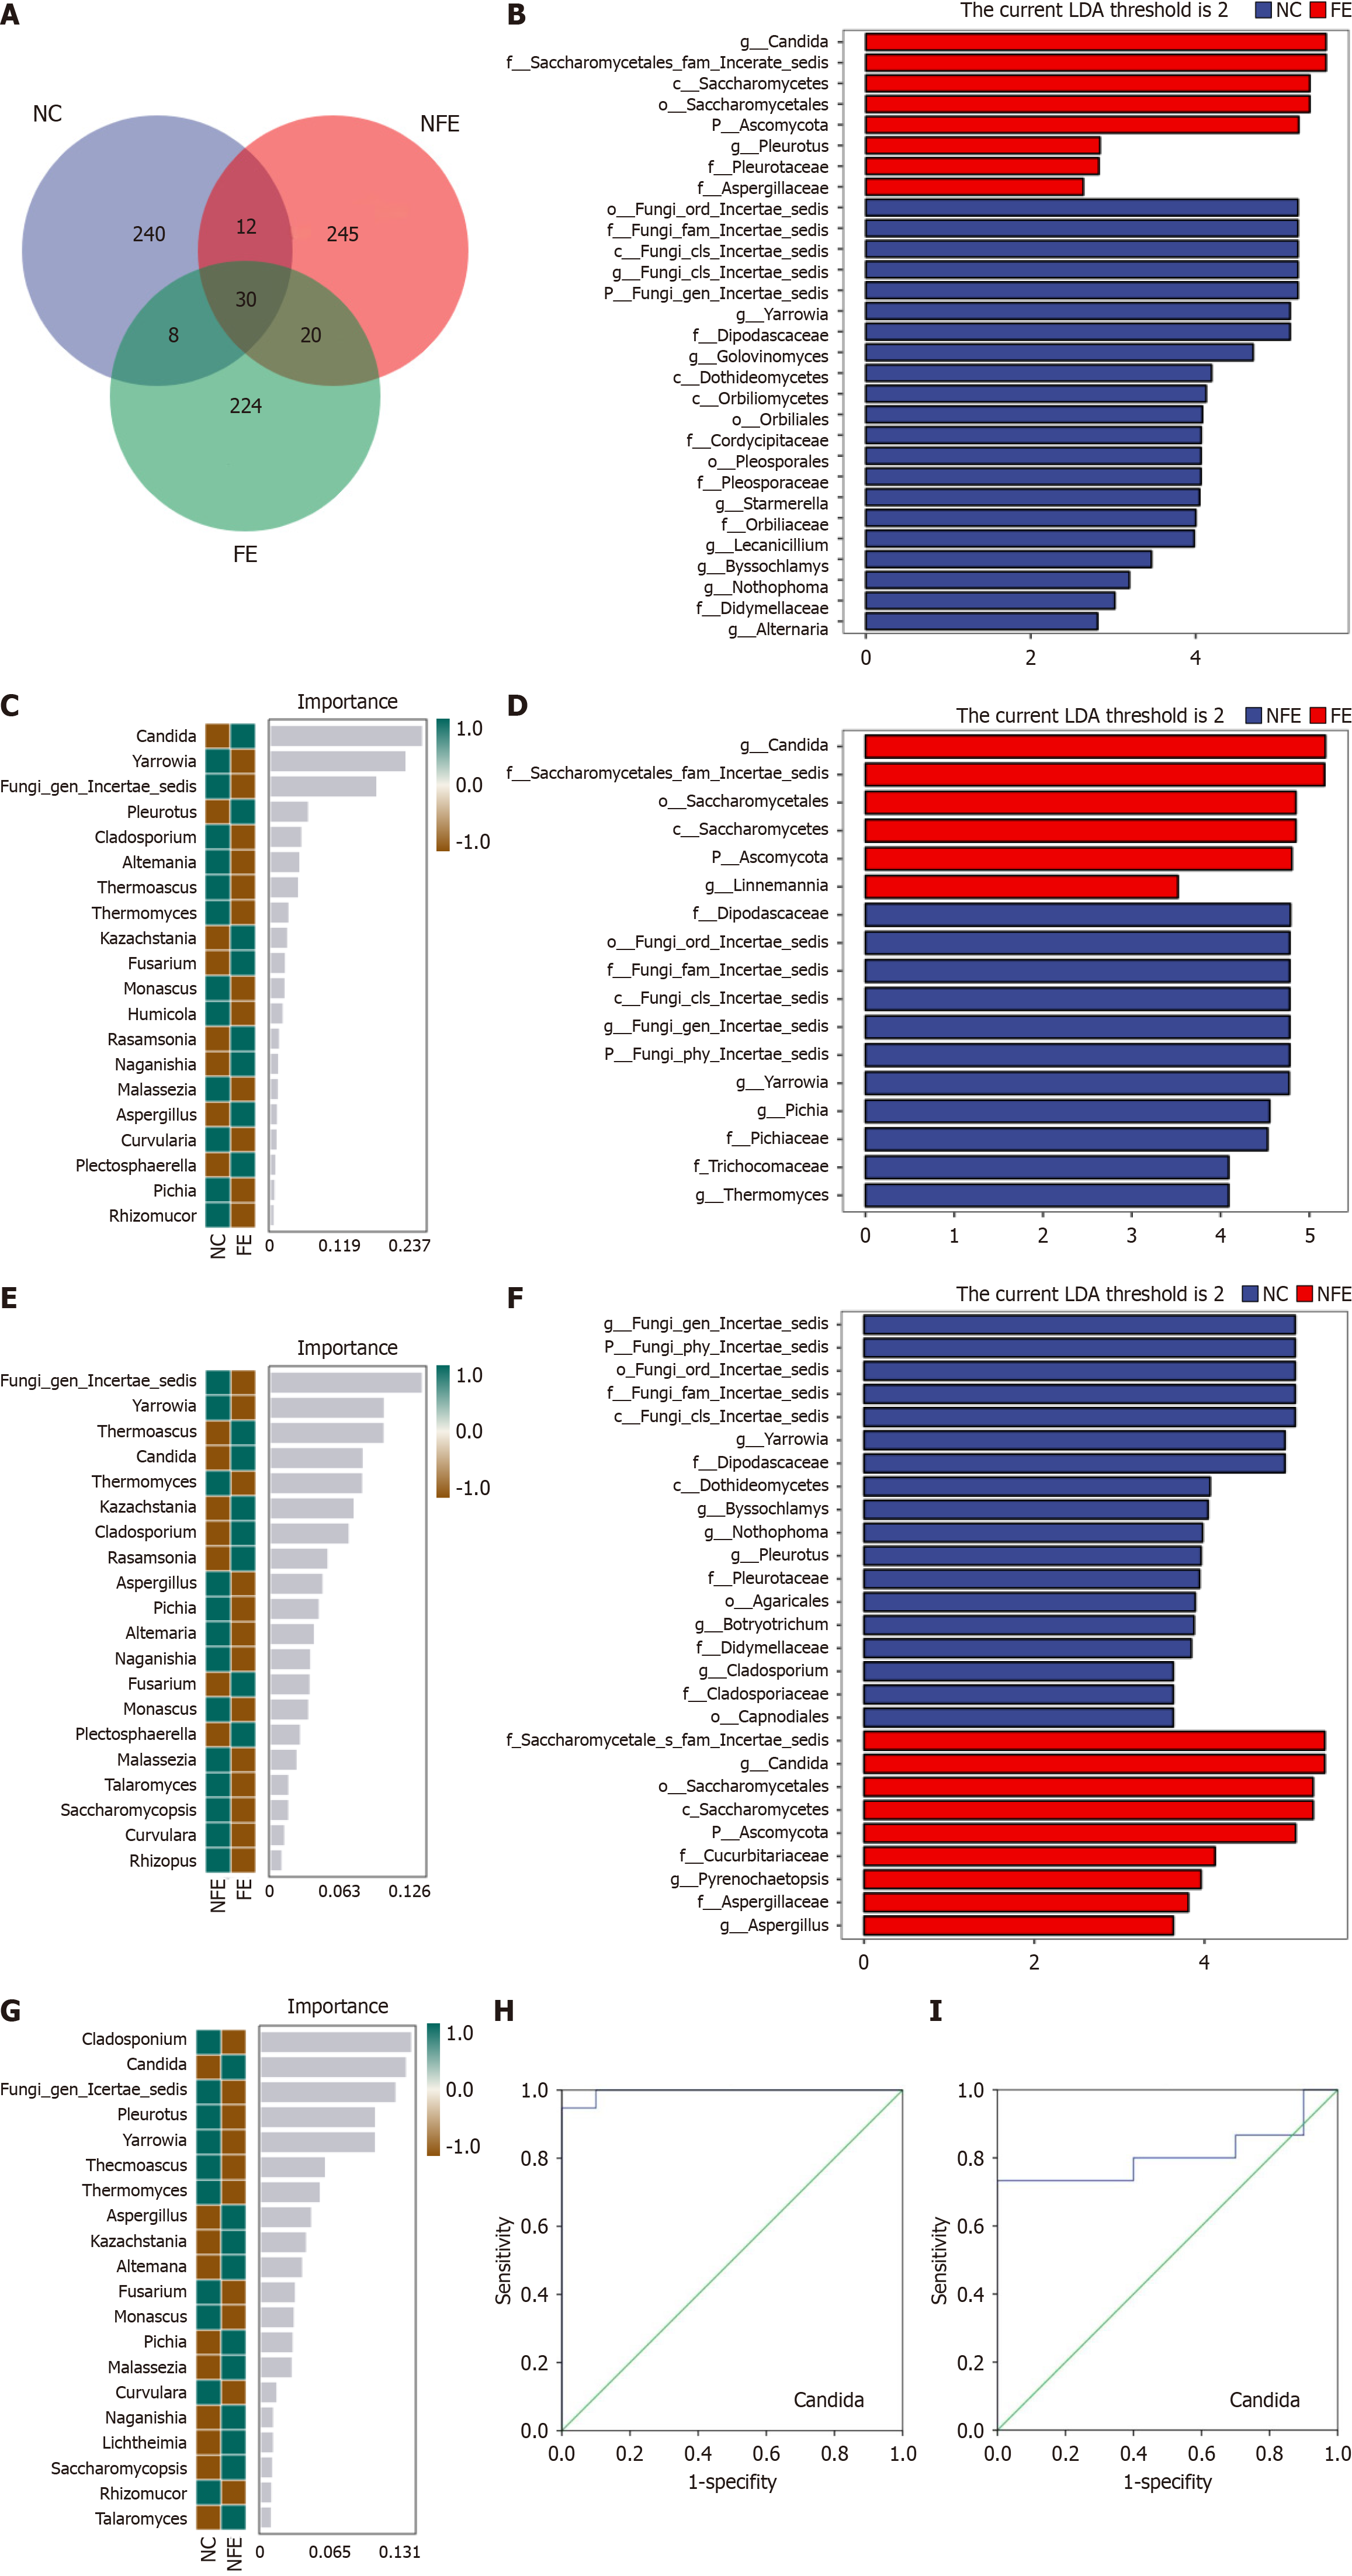
Figure 4 Specific species differences in the three groups.
A: Venn diagram based on amplicon sequence variant (ASV) level. Each color block represents a group, and the overlapping areas between the color blocks indicate the ASVs shared among the corresponding groups. The number of each block indicates the number of ASVs contained in that block; B: Linear discriminant analysis Effect Size (LEfSe) analysis of the esophageal normal controls (NCs) group and fungal esophagitis (FE) group at genus level; C: Random forest analysis of NCs group and FE group at genus level; D: LEfSe analysis of suspected FE group and FE group at genus level; E: Random forest analysis of suspected FE group and FE group at genus level; F: LEfSe analysis of suspected FE group and NCs group at genus level; G: Random forest analysis of suspected FE group and NCs group at genus level; H: Receiver operating characteristic (ROC) curve of Candida species relative abundance in the NCs group and FE group; I: ROC curve of Candida species relative abundance in the NCs group and suspected FE group. NC: The esophageal normal control; NFE: Suspected fungal esophagitis; FE: Fungal esophagitis.
- Citation: Song YK, Zheng L, Liu AX, Ma JJ. Internal transcribed spacer sequencing to explore the intrinsic composition of fungal communities in fungal esophagitis. World J Gastroenterol 2025; 31(7): 101104
- URL: https://www.wjgnet.com/1007-9327/full/v31/i7/101104.htm
- DOI: https://dx.doi.org/10.3748/wjg.v31.i7.101104


