Copyright
©The Author(s) 2025.
World J Gastroenterol. Jan 28, 2025; 31(4): 101749
Published online Jan 28, 2025. doi: 10.3748/wjg.v31.i4.101749
Published online Jan 28, 2025. doi: 10.3748/wjg.v31.i4.101749
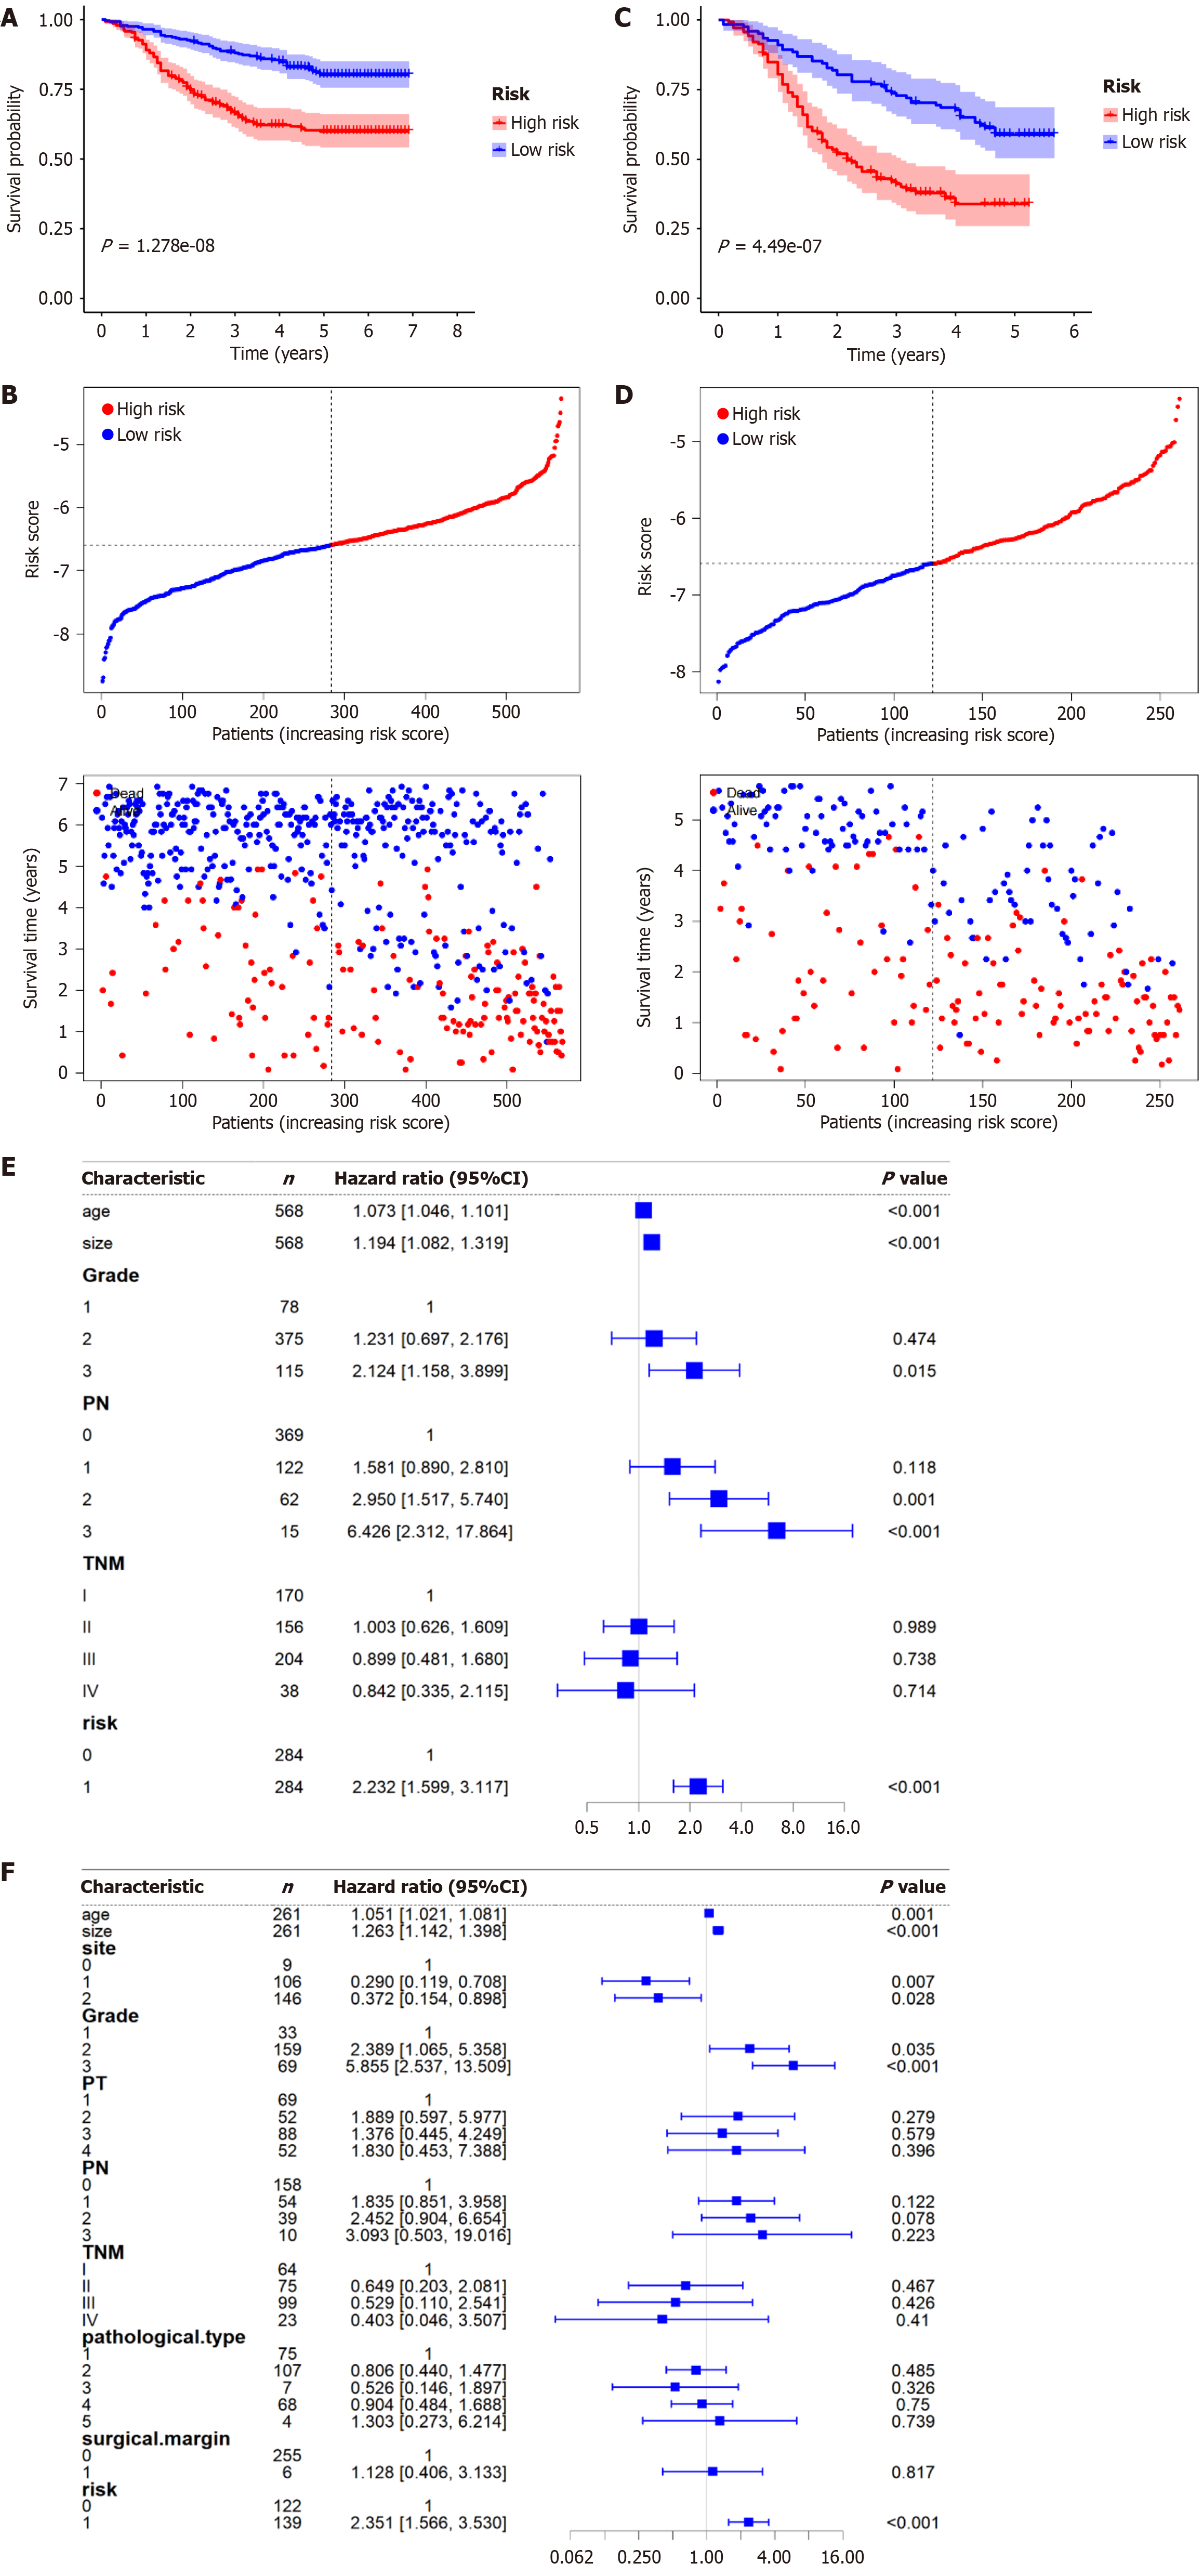
Figure 4 Prognostic implications of the nutritional immune-inflammatory status score.
A and B: The Kaplan-Meier curves of overall survival (OS; A) and the distribution of survival status (B) for patients in the low- and high-risk groups based on the nutritional immune-inflammatory status (NIIS) score in the training set; C and D: The Kaplan-Meier curves of OS (C) and the distribution of survival status (D) for patients in the low- and high-risk groups based on the NIIS score in the validation set; E: Forest plot of multivariable Cox regression analysis of OS in the training set; F: Forest plot of multivariable Cox regression analysis of OS in the validation set. 95%CI: 95% confidence intervals.
- Citation: Liu QW, Liu L, Hu JX, Hou JQ, He WB, Shu YS, Wang XL. Nomogram based on a novel nutritional immune-inflammatory status score to predict postoperative outcomes in esophageal squamous cell carcinoma. World J Gastroenterol 2025; 31(4): 101749
- URL: https://www.wjgnet.com/1007-9327/full/v31/i4/101749.htm
- DOI: https://dx.doi.org/10.3748/wjg.v31.i4.101749


