Copyright
©The Author(s) 2025.
World J Gastroenterol. Jan 28, 2025; 31(4): 100401
Published online Jan 28, 2025. doi: 10.3748/wjg.v31.i4.100401
Published online Jan 28, 2025. doi: 10.3748/wjg.v31.i4.100401
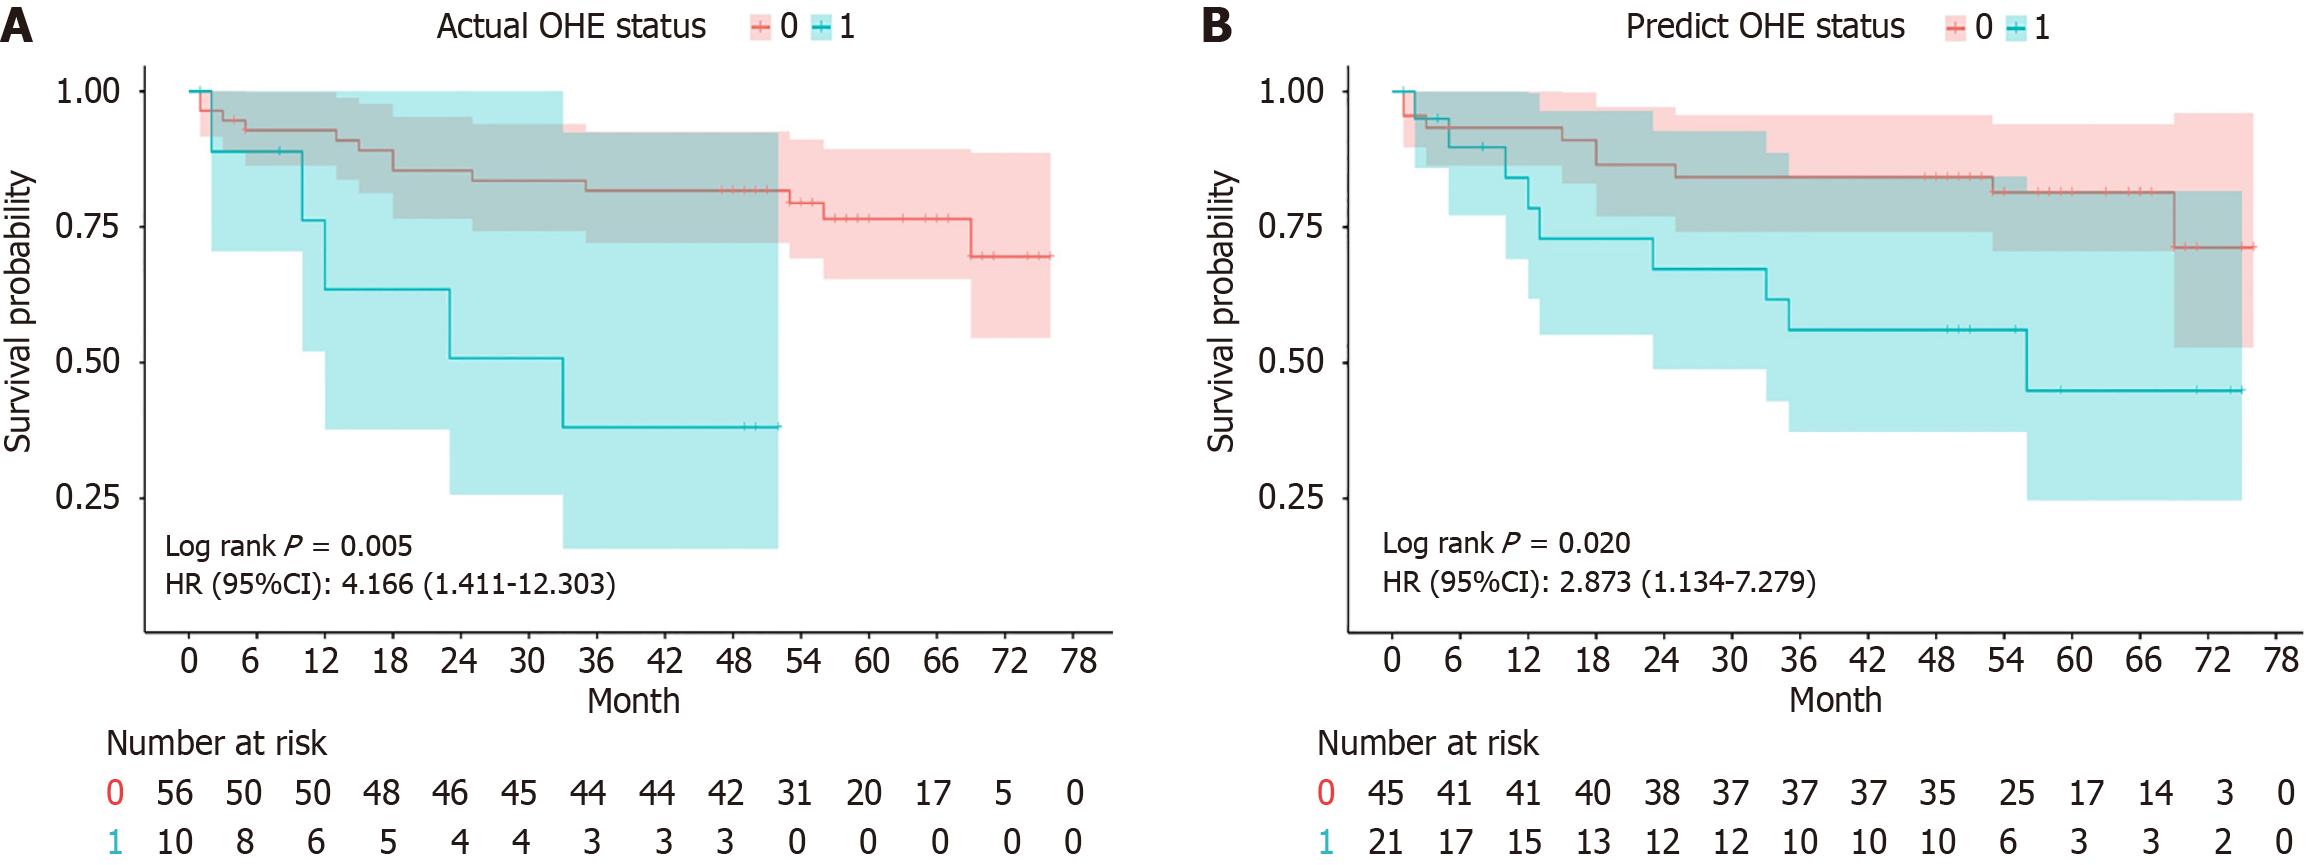
Figure 4 Kaplan-Meier survival curves comparing different overt hepatic encephalopathy status groups.
A: Survival analysis based on actual overt hepatic encephalopathy (OHE) status; B: Survival analysis based on predicted OHE status. CI: Confidence interval; HR Hazard ratio; OHE: Overt hepatic encephalopathy.
- Citation: Liu DJ, Jia LX, Zeng FX, Zeng WX, Qin GG, Peng QF, Tan Q, Zeng H, Ou ZY, Kun LZ, Zhao JB, Chen WG. Machine learning prediction of hepatic encephalopathy for long-term survival after transjugular intrahepatic portosystemic shunt in acute variceal bleeding. World J Gastroenterol 2025; 31(4): 100401
- URL: https://www.wjgnet.com/1007-9327/full/v31/i4/100401.htm
- DOI: https://dx.doi.org/10.3748/wjg.v31.i4.100401


