Copyright
©The Author(s) 2025.
World J Gastroenterol. Jan 28, 2025; 31(4): 100401
Published online Jan 28, 2025. doi: 10.3748/wjg.v31.i4.100401
Published online Jan 28, 2025. doi: 10.3748/wjg.v31.i4.100401
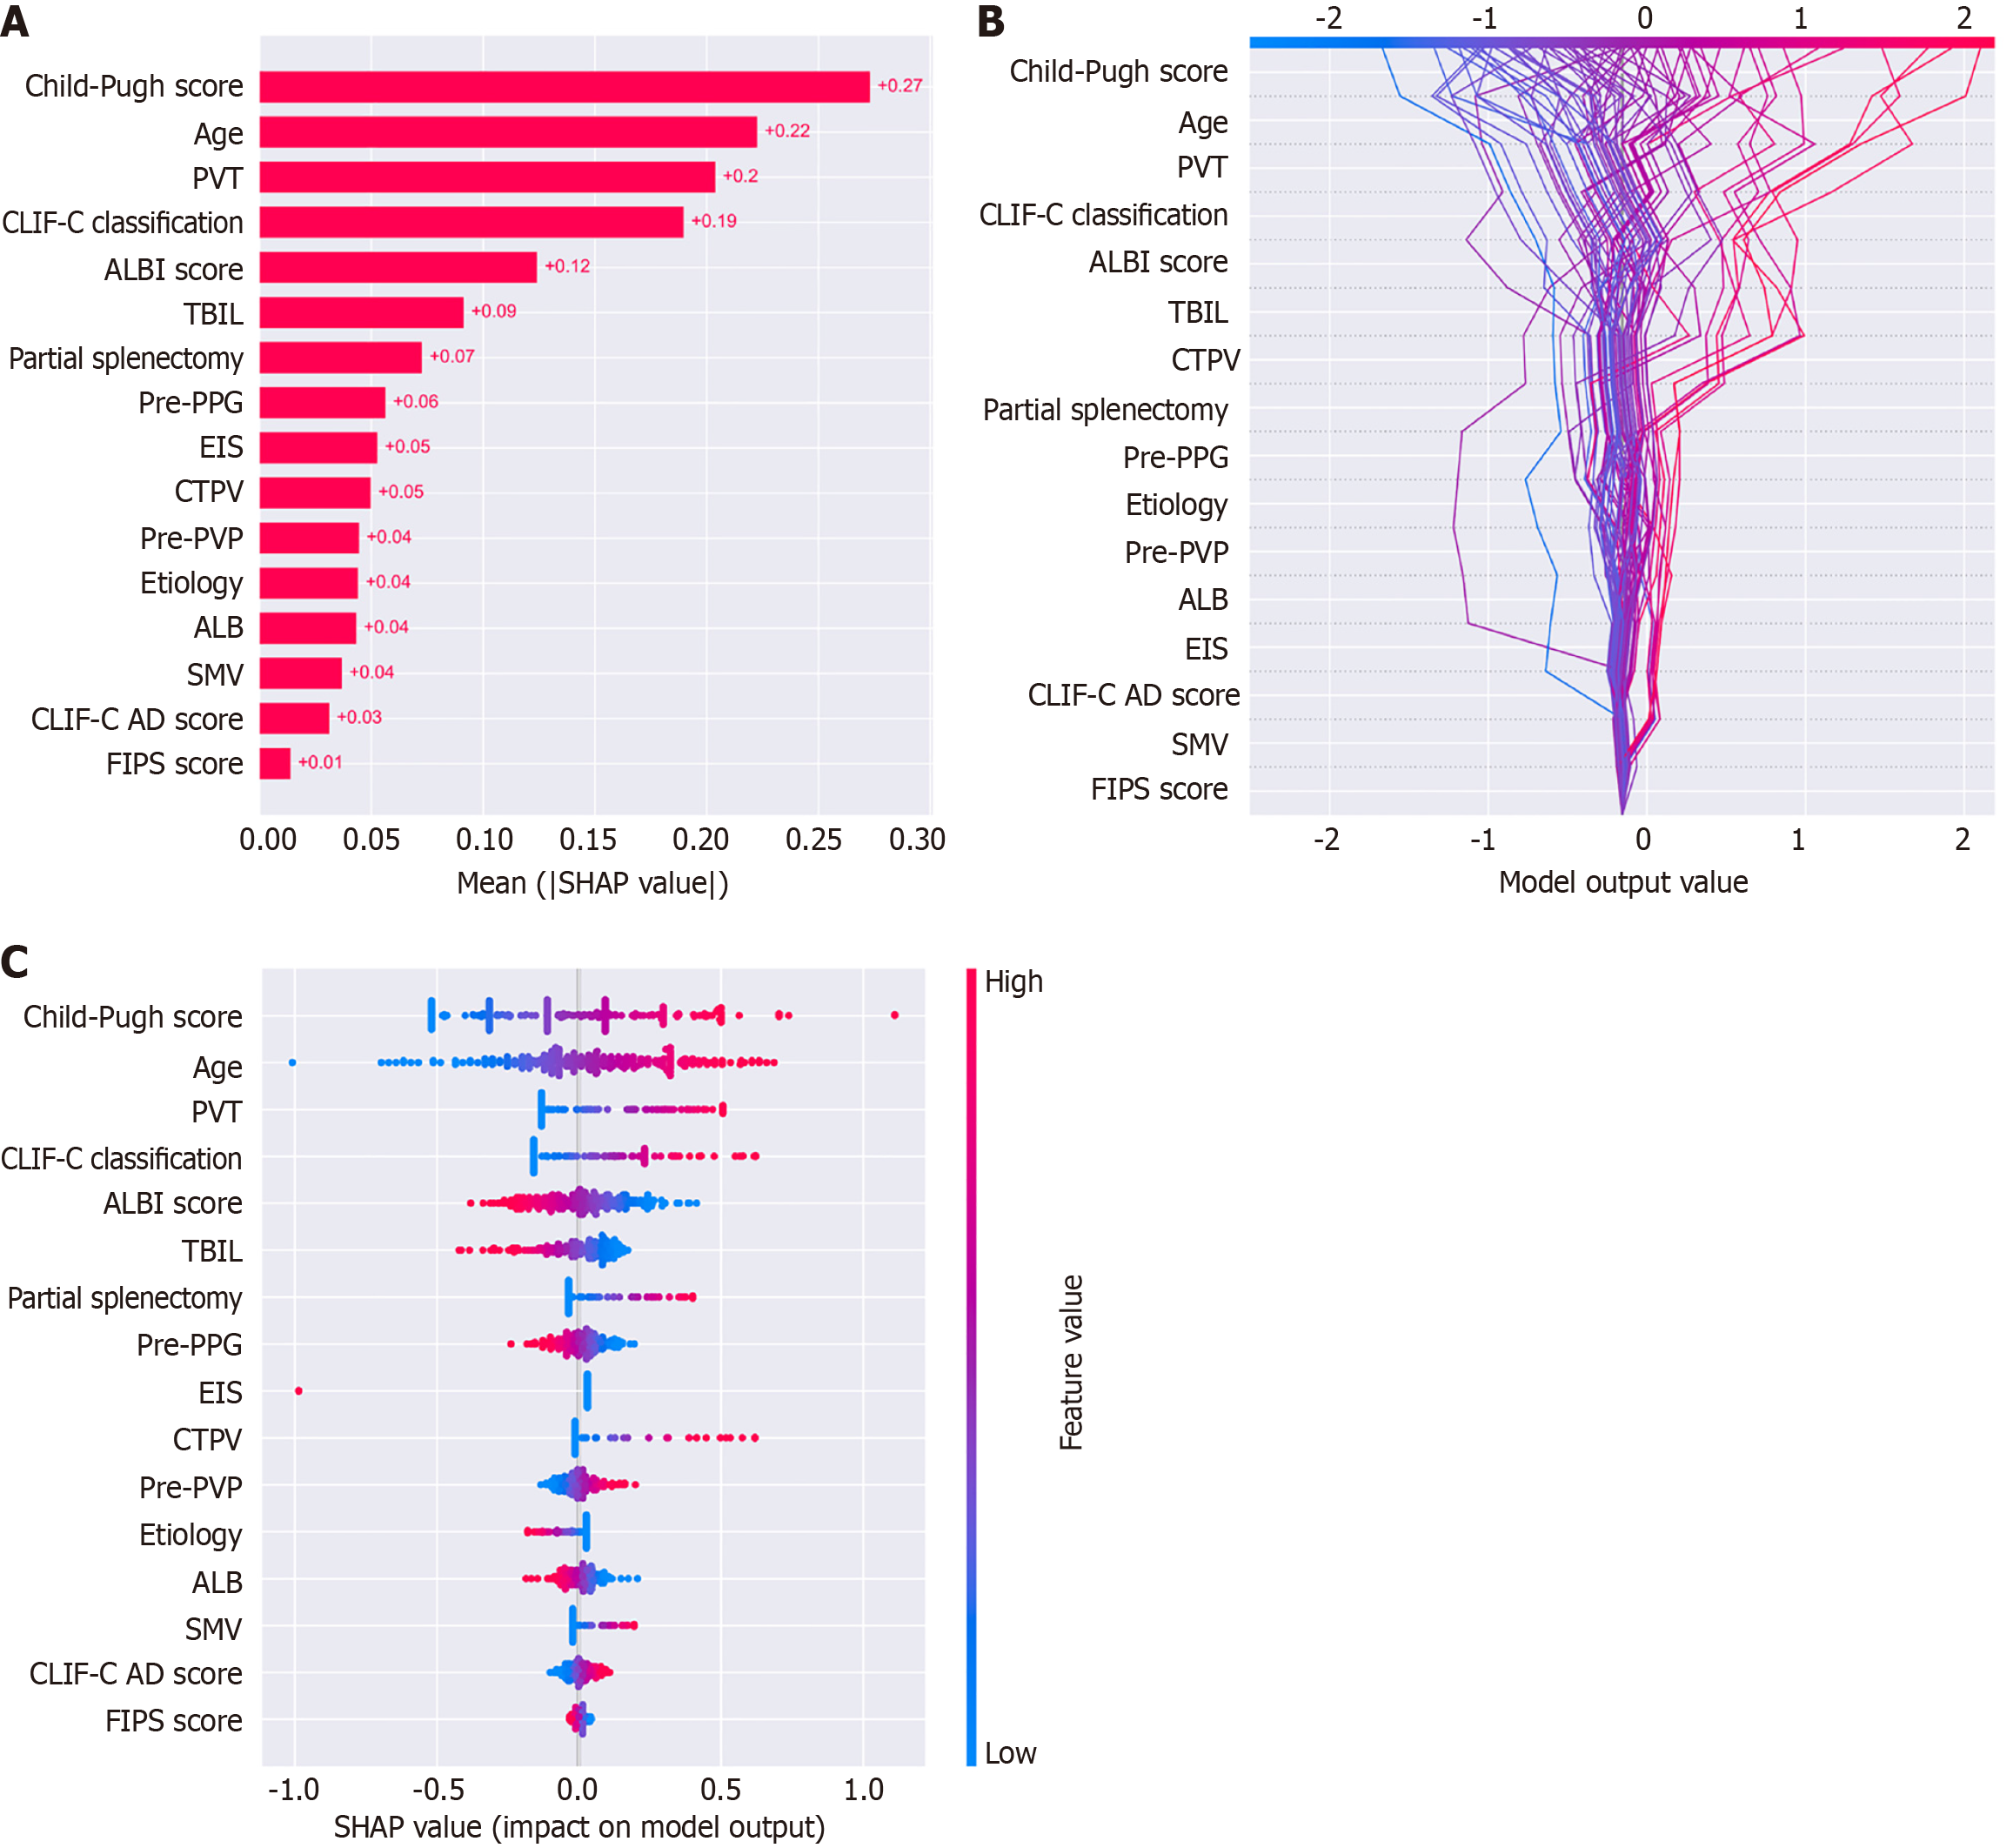
Figure 3 Analysis of feature importance using SHapley Additive exPlanations values in the logistic regression model.
A: Bar chart displaying the mean SHapley Additive exPlanations (SHAP) values, which indicate the average impact of each feature on the model output; B: Beeswarm plot showing the distribution of SHAP values for individual predictions; C: Summary plot combining SHAP values and feature importance, with feature values represented by color (blue for low and red for high). PVT: Portal vein thrombosis; CLIF-C: Chronic liver failure consortium; ALBI: Albumin-bilirubin; TBIL: Total bilirubin; PPG: Portal pressure gradient; EIS: Endoscopic injection sclerotherapy; CTPV: Cavernous transformation of the portal vein; PVP: Portal venous pressure; ALB: Albumin; SMV: Superior mesenteric vein thrombosis; CLIF-C AD: Chronic liver failure consortium acute decompensation; FIPS: Fibrosis-4 index for liver fibrosis; SHAP: SHapley Additive exPlanations.
- Citation: Liu DJ, Jia LX, Zeng FX, Zeng WX, Qin GG, Peng QF, Tan Q, Zeng H, Ou ZY, Kun LZ, Zhao JB, Chen WG. Machine learning prediction of hepatic encephalopathy for long-term survival after transjugular intrahepatic portosystemic shunt in acute variceal bleeding. World J Gastroenterol 2025; 31(4): 100401
- URL: https://www.wjgnet.com/1007-9327/full/v31/i4/100401.htm
- DOI: https://dx.doi.org/10.3748/wjg.v31.i4.100401


