Copyright
©The Author(s) 2025.
World J Gastroenterol. Jan 21, 2025; 31(3): 98688
Published online Jan 21, 2025. doi: 10.3748/wjg.v31.i3.98688
Published online Jan 21, 2025. doi: 10.3748/wjg.v31.i3.98688
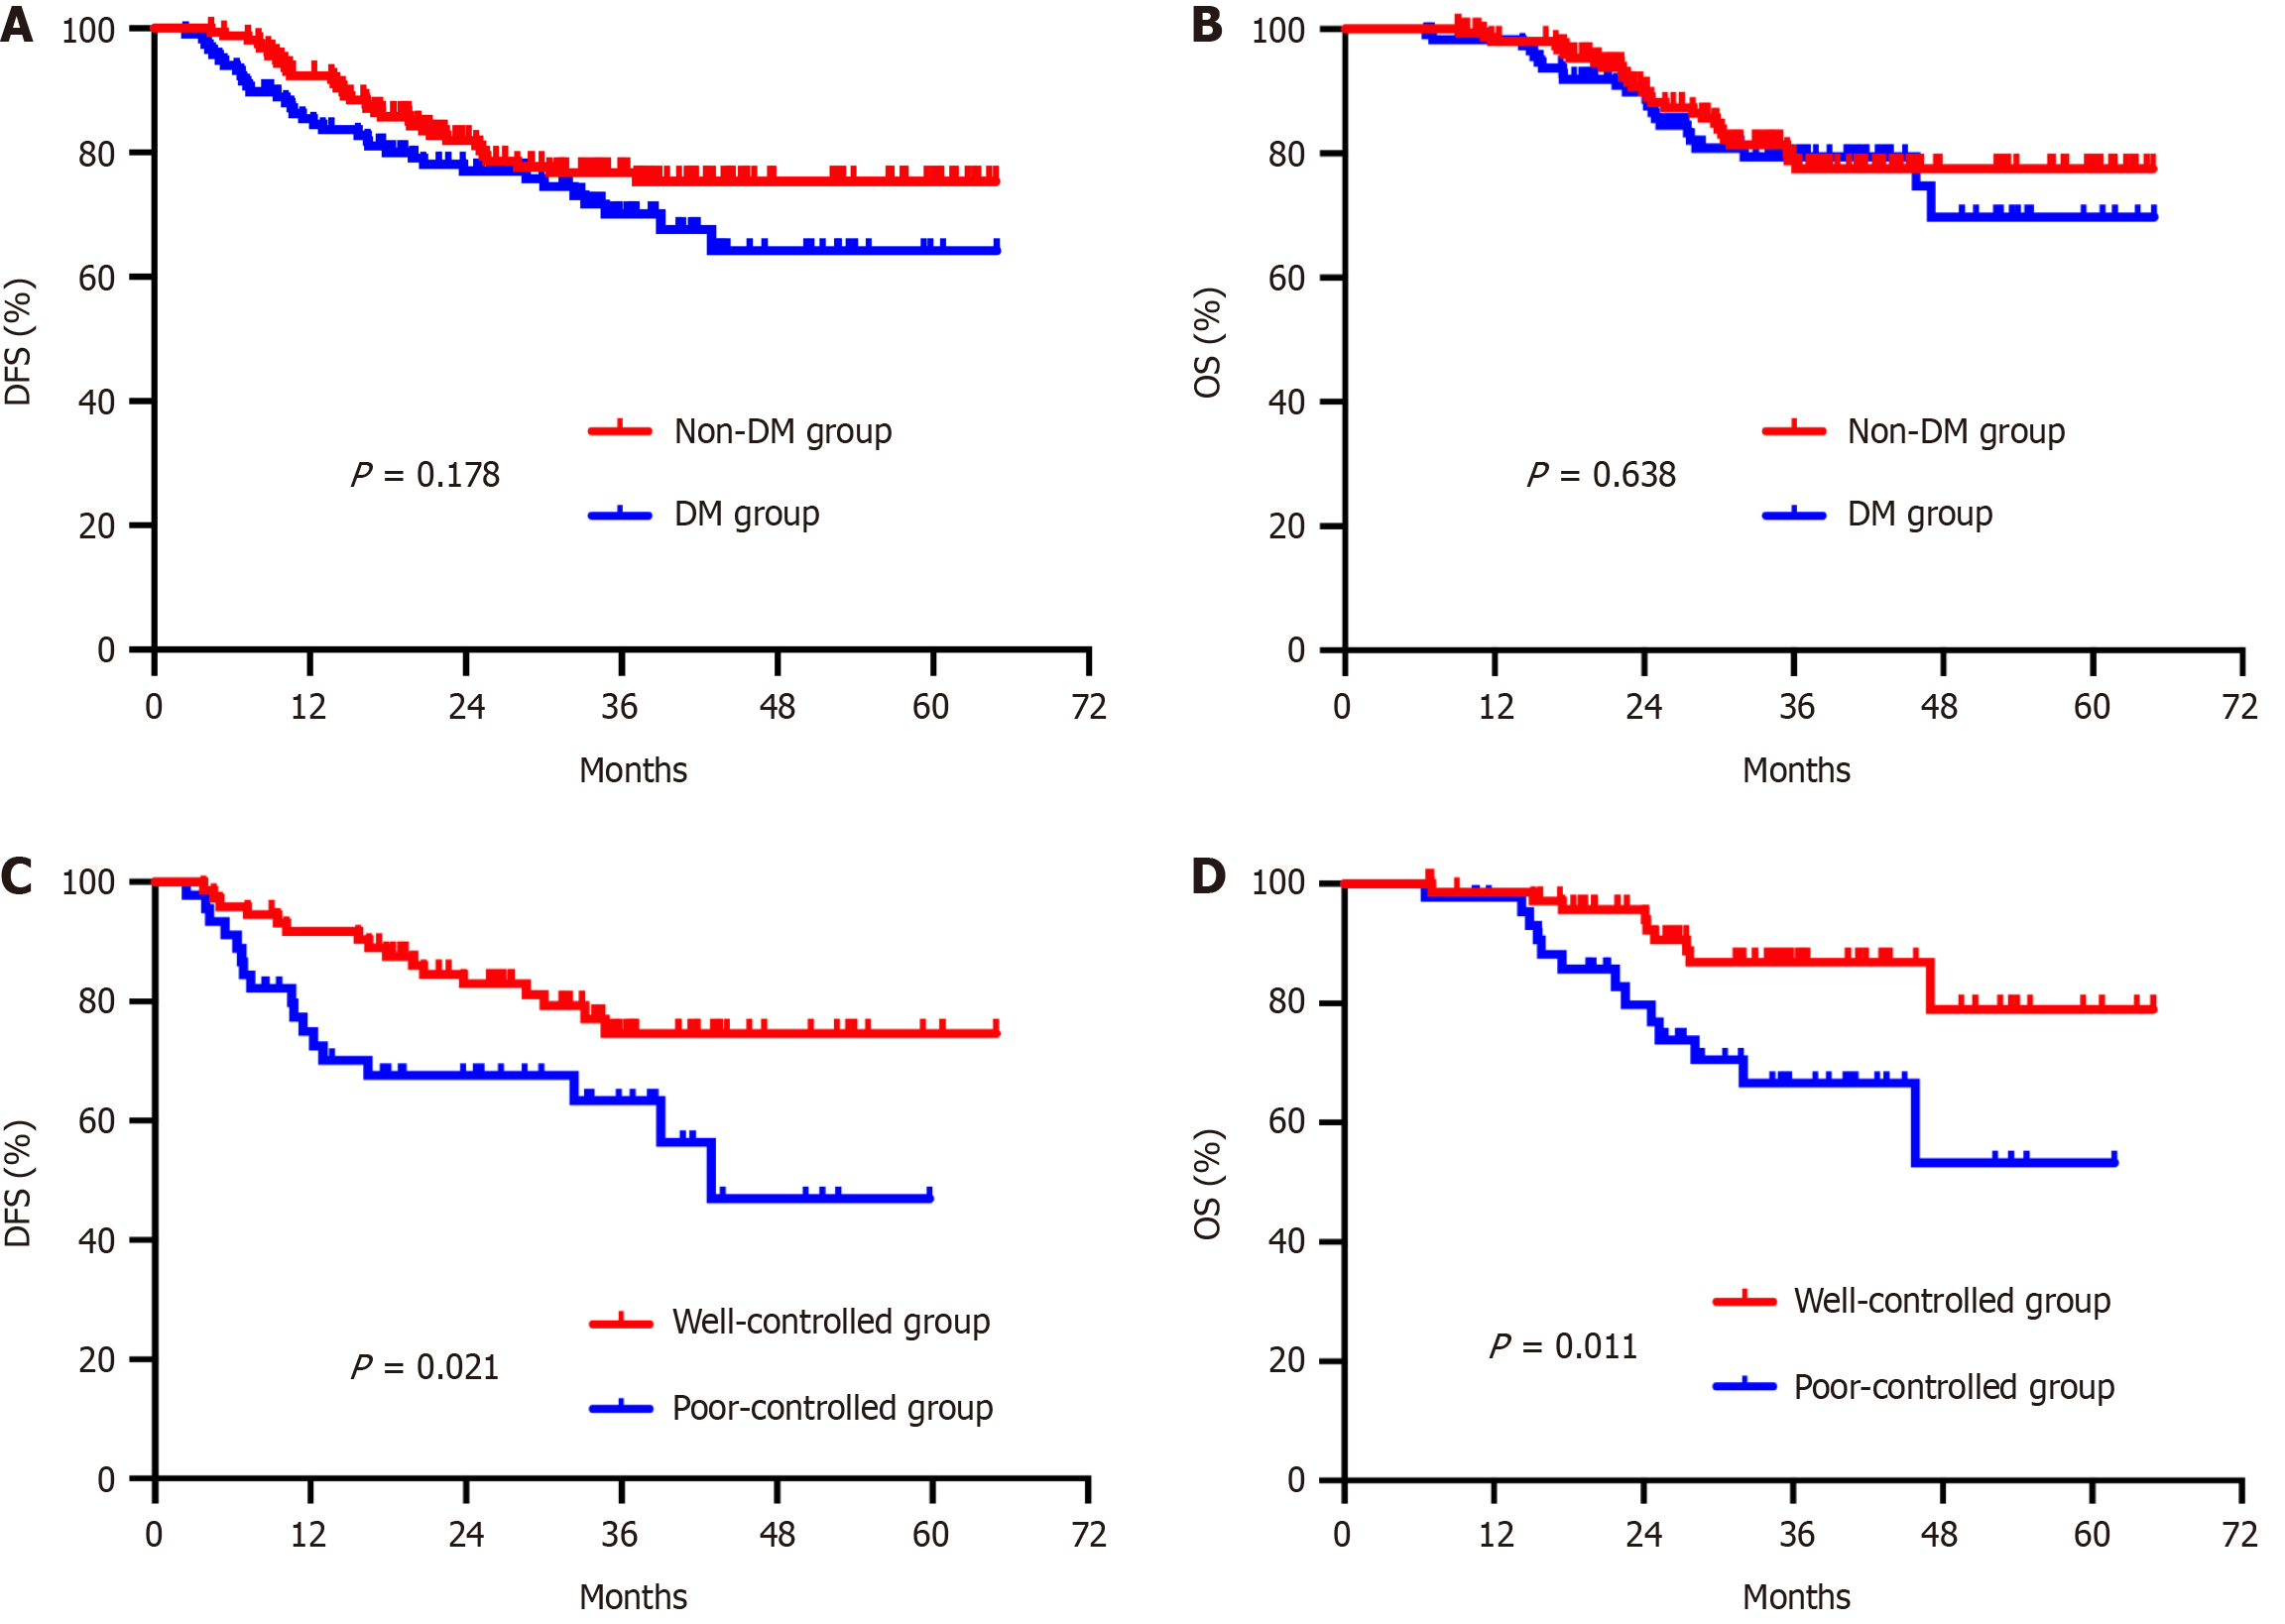
Figure 2 Comparisons of the prognostic outcomes of patients in the non-diabetes mellitus, diabetes mellitus, well-controlled and poorly controlled groups.
A: Comparison of disease-free survival rates between the non-diabetes mellitus (DM) and DM groups (P = 0.178); B: Comparison of overall survival rates between the non-DM and DM groups (P = 0.638); C: Comparison of disease-free survival rates between the well-controlled and poorly controlled groups (P = 0.021); D: Comparison of overall survival rates between the well-controlled and poorly controlled groups (P = 0.011). DFS: Disease-free survival; OS: Overall survival.
- Citation: Guan RY, Wu JW, Yuan ZY, Liu ZY, Liu ZZ, Xiao ZC, Li JH, Huang CZ, Wang JJ, Yao XQ. Poorly controlled type II diabetes mellitus significantly enhances postoperative chemoresistance in patients with stage III colon cancer. World J Gastroenterol 2025; 31(3): 98688
- URL: https://www.wjgnet.com/1007-9327/full/v31/i3/98688.htm
- DOI: https://dx.doi.org/10.3748/wjg.v31.i3.98688


