Copyright
©The Author(s) 2025.
World J Gastroenterol. Apr 21, 2025; 31(15): 104996
Published online Apr 21, 2025. doi: 10.3748/wjg.v31.i15.104996
Published online Apr 21, 2025. doi: 10.3748/wjg.v31.i15.104996
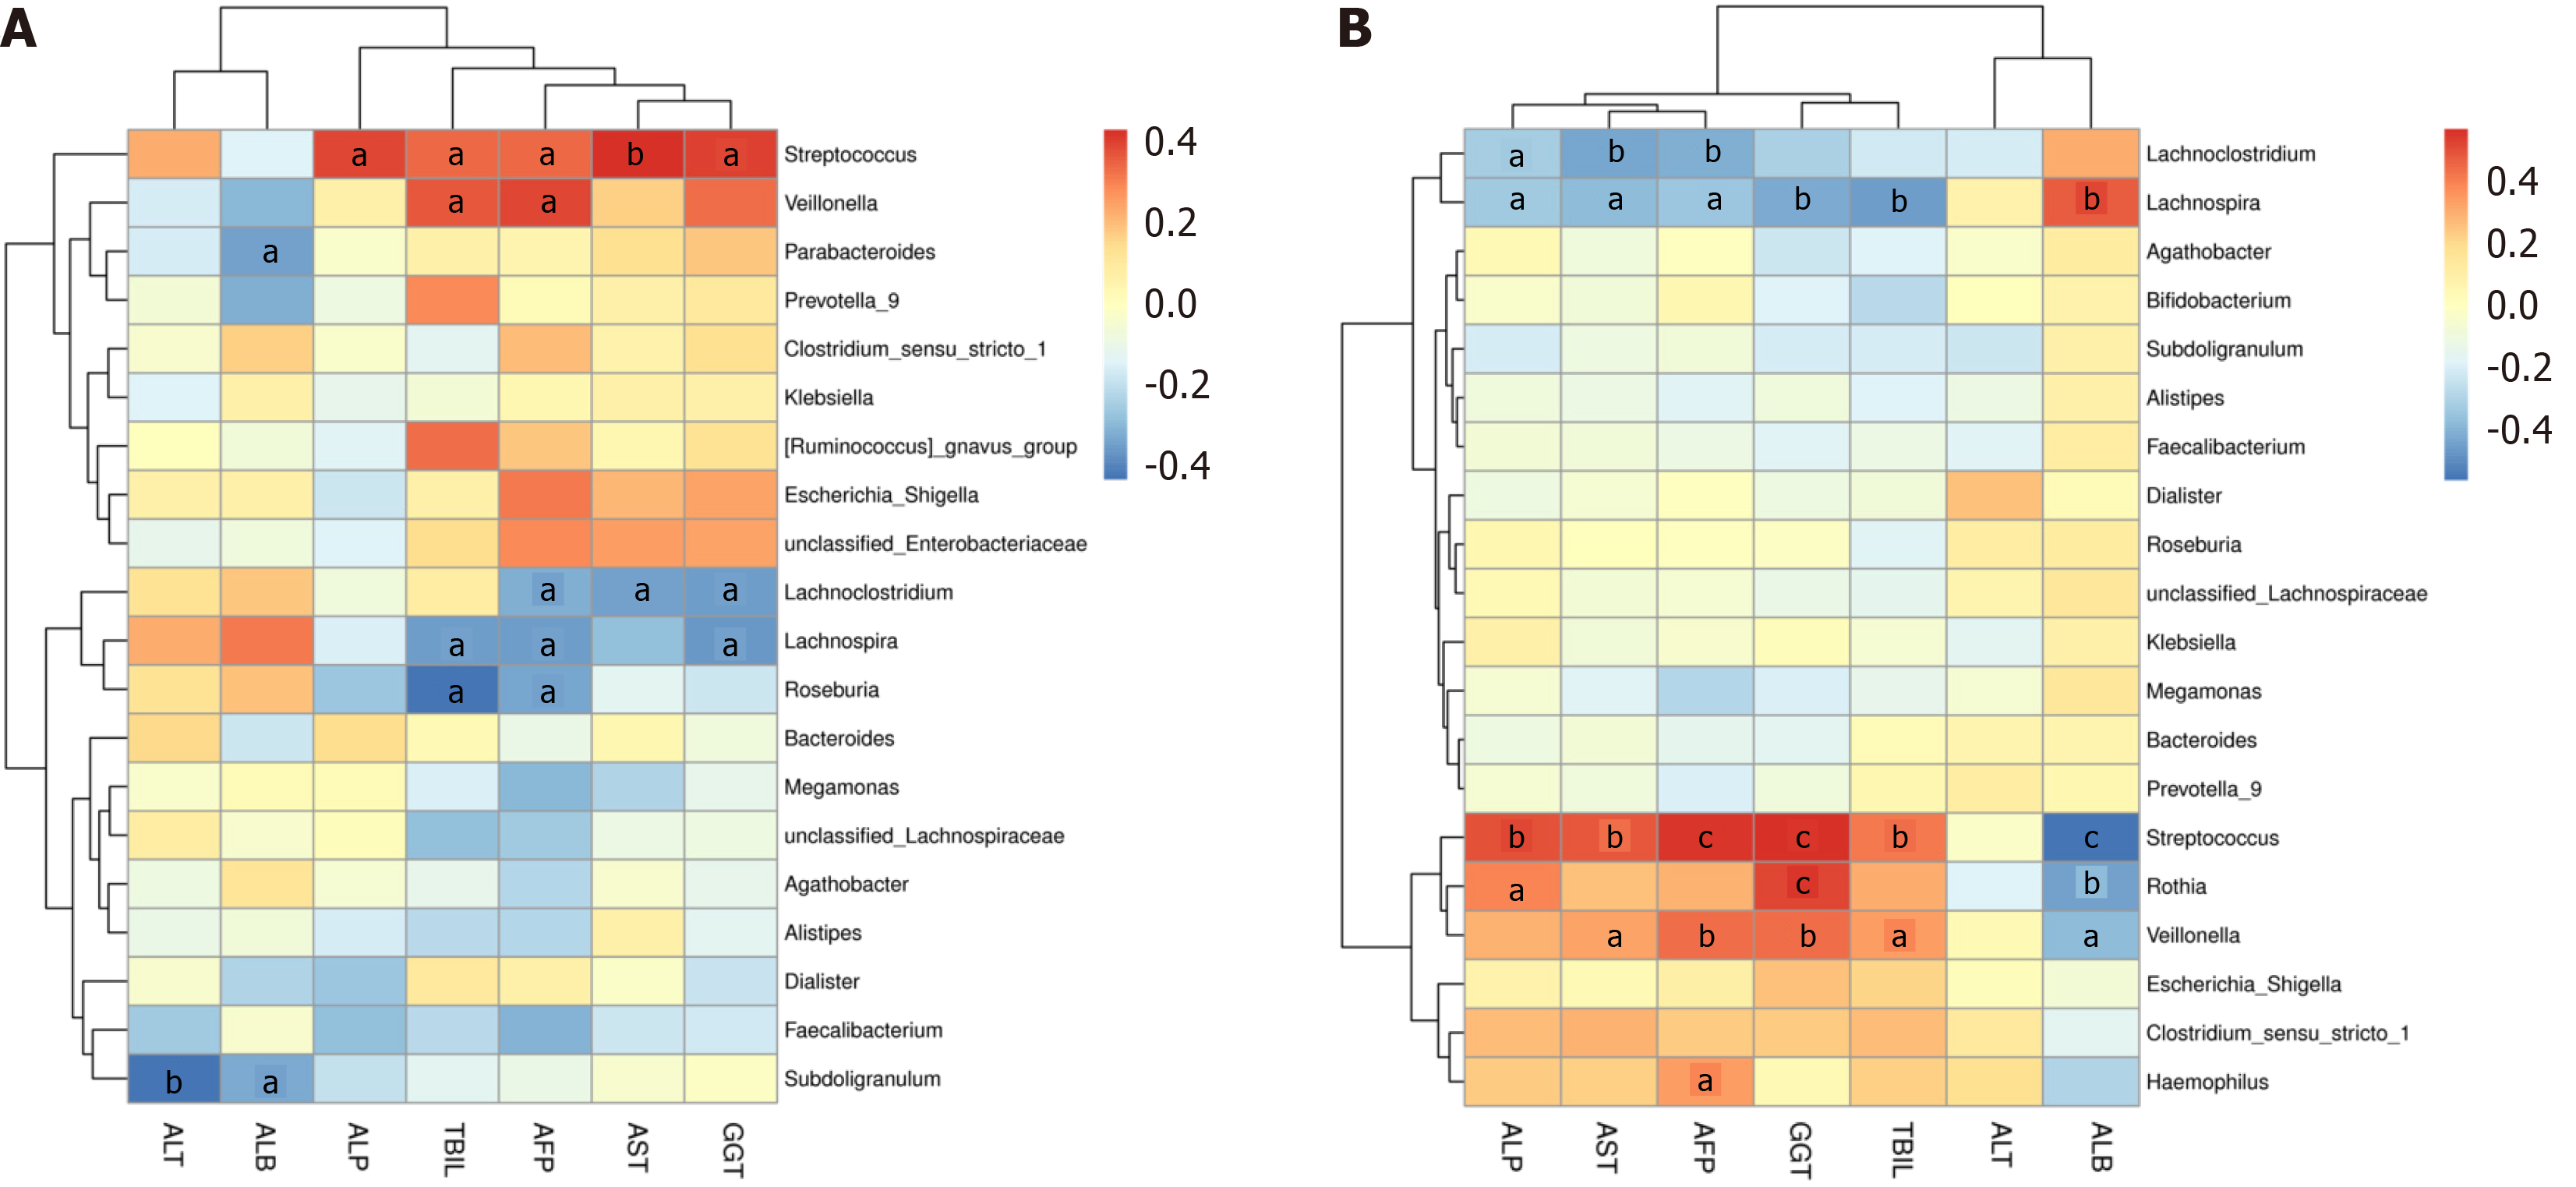
Figure 6 Correlation analysis of intestinal microbiota and serum indicators.
The heatmap presents the correlations between the top 20 differentially abundant bacterial genera and serum indicators. A: In the comparisons healthy control (HC) vs comprising patients with stage I and II hepatocellular carcinoma (HCC12); B: HC vs comprising patients with stage III and IV hepatocellular carcinoma (HCC34). aP < 0.05. bP < 0.01. cP < 0.001. ALT: Alanine aminotransferase; AST: Aspartate aminotransferase; ALB: Albumin; ALP: Alkaline phosphatase; GGT: γ-glutamyl transferase; TBIL: Total bilirubin; AFP: Alpha-fetoprotein.
- Citation: Feng J, Wang JP, Hu JR, Li P, Lv P, He HC, Cheng XW, Cao Z, Han JJ, Wang Q, Su Q, Liu LX. Multi-omics reveals the associations among the fecal metabolome, intestinal bacteria, and serum indicators in patients with hepatocellular carcinoma. World J Gastroenterol 2025; 31(15): 104996
- URL: https://www.wjgnet.com/1007-9327/full/v31/i15/104996.htm
- DOI: https://dx.doi.org/10.3748/wjg.v31.i15.104996


