Copyright
©The Author(s) 2025.
World J Gastroenterol. Apr 21, 2025; 31(15): 101058
Published online Apr 21, 2025. doi: 10.3748/wjg.v31.i15.101058
Published online Apr 21, 2025. doi: 10.3748/wjg.v31.i15.101058
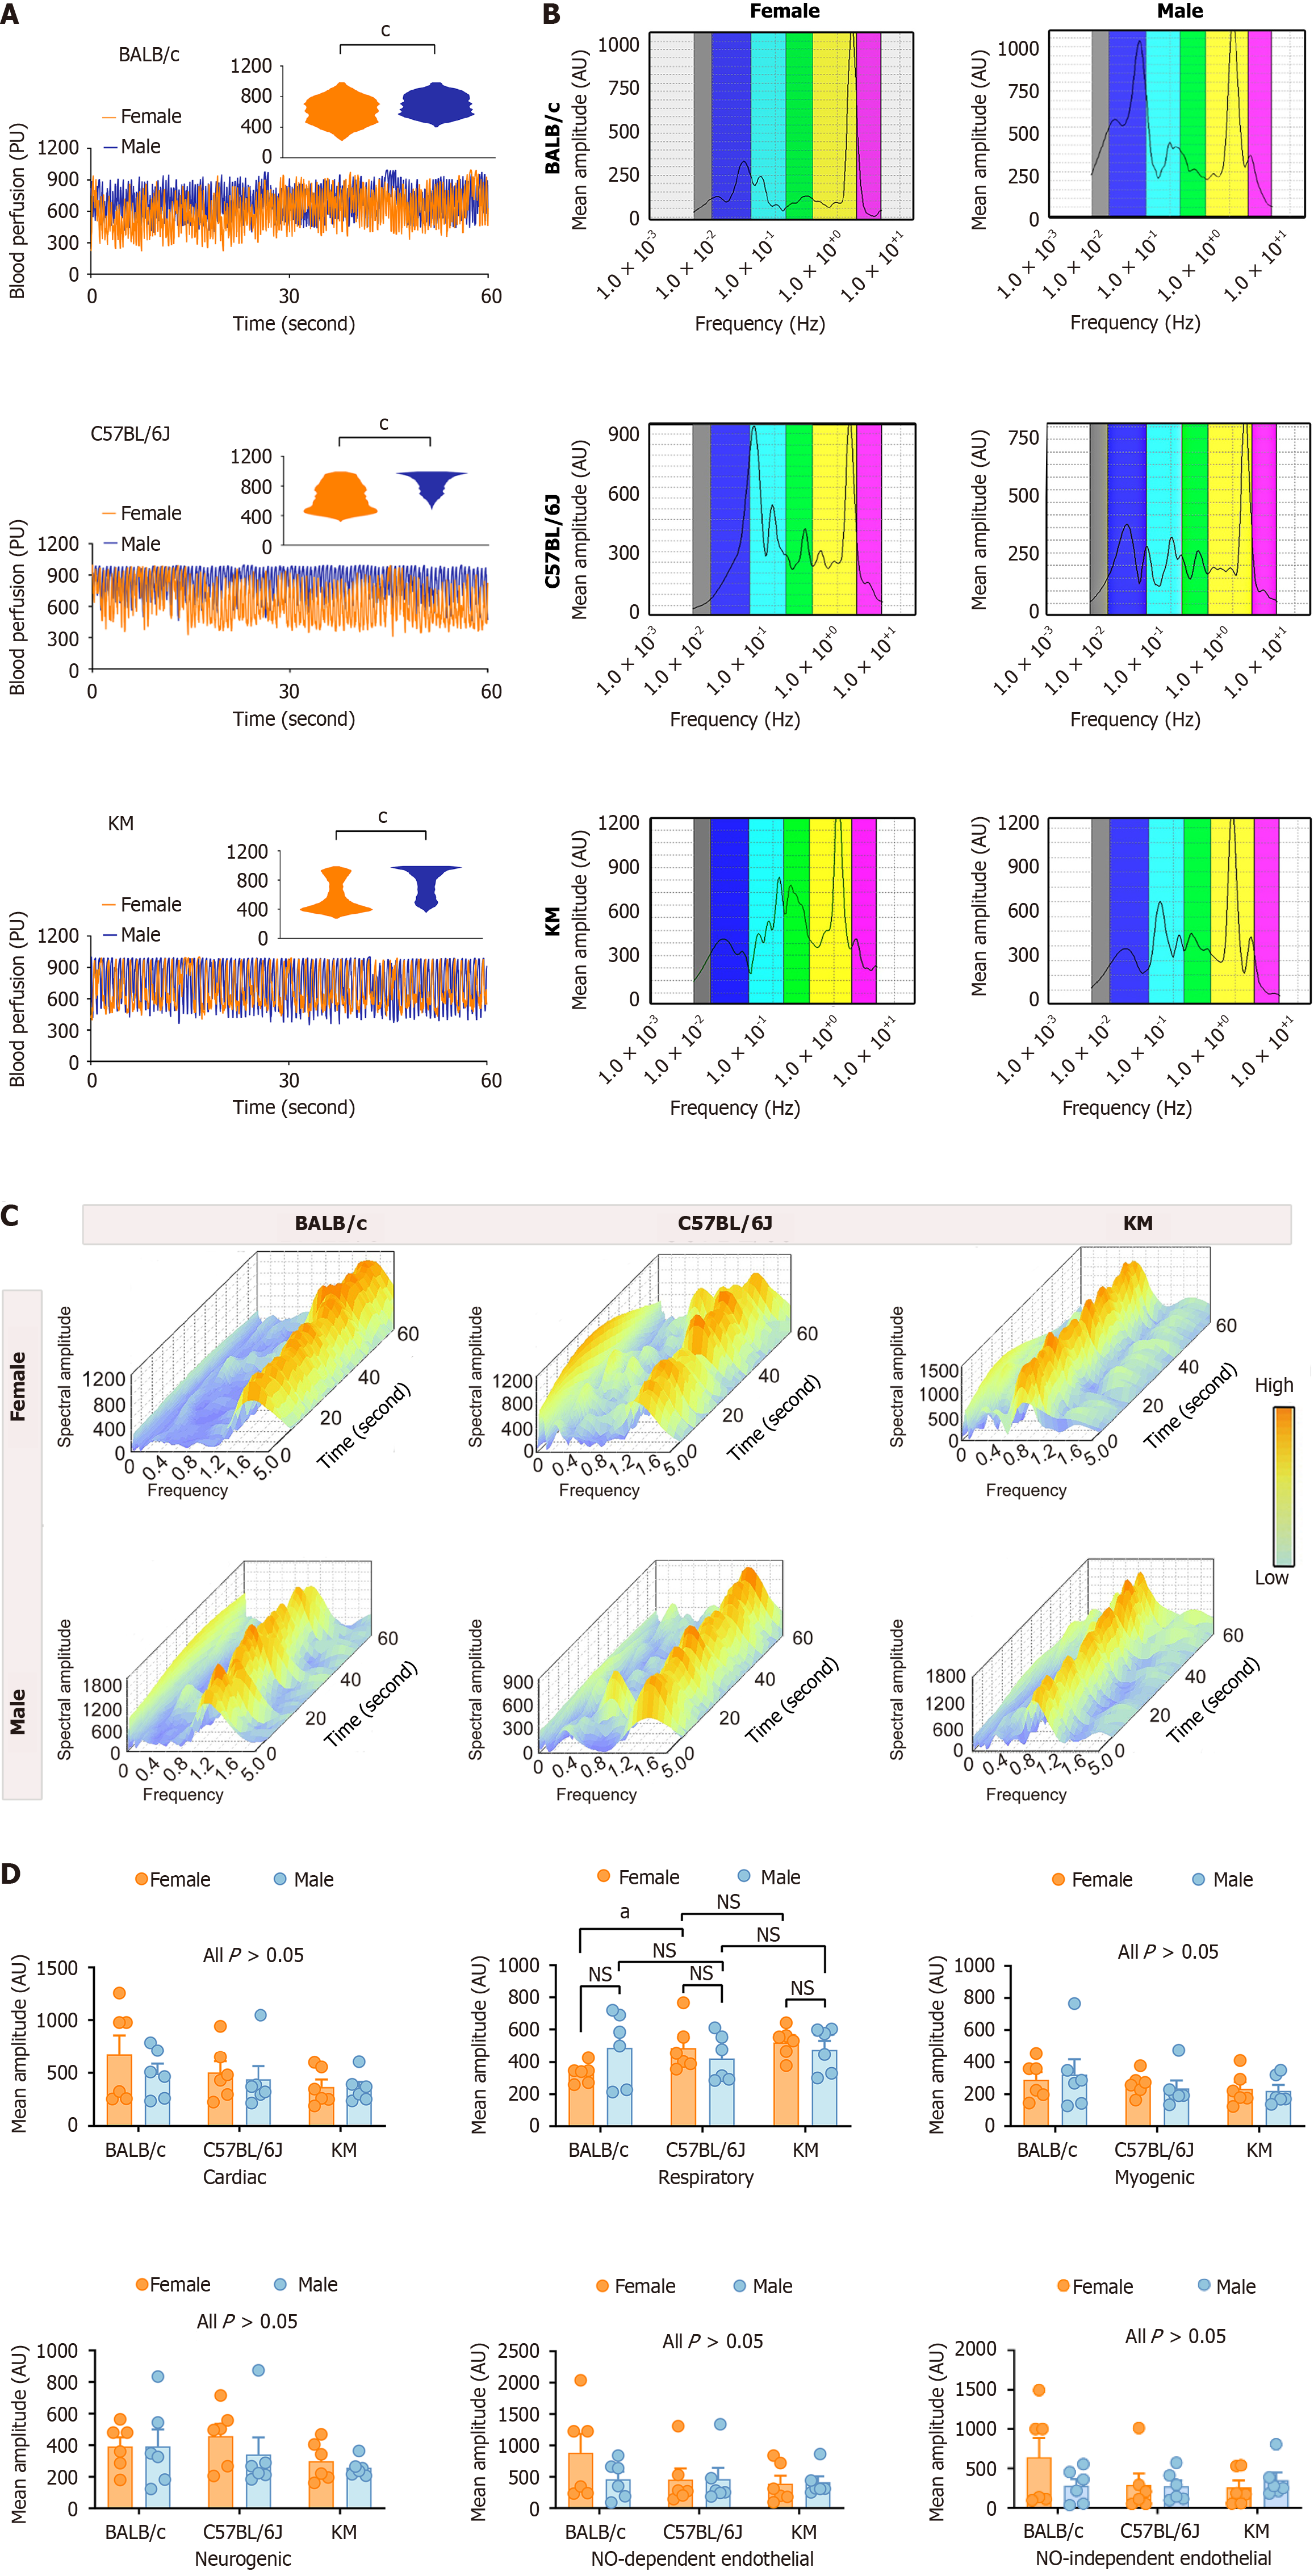
Figure 1 Comparative analysis of hepatic microcirculatory blood perfusion and characteristic oscillatory amplitudes between sexes and across three mouse strains.
A: Hepatic microcirculatory blood perfusion patterns in the BALB/c, C57BL/6J, and KM mouse strains. The rectangular insert highlights the extracted pattern of microcirculatory blood distribution; B and C: Two-dimensional and three-dimensional spectral scalograms representing the characteristic amplitudes of hepatic microcirculation profiles; D: Quantitative analysis of characteristic oscillatory amplitudes in hepatic microcirculatory blood perfusion profiles. The data are presented as the mean ± SEM. n = 6 each group. aP < 0.05. cP < 0.001. AU: Amplitude; NO: Nitric oxide; NS: Not significant; PU: Perfusion unit.
- Citation: Wang B, Li Y, Ouyang Q, Xu MT, Wang YY, Fu SJ, Liu WQ, Liu XT, Ling H, Zhang X, Xiu RJ, Liu MM. Strain- and sex-dependent variability in hepatic microcirculation and liver function in mice. World J Gastroenterol 2025; 31(15): 101058
- URL: https://www.wjgnet.com/1007-9327/full/v31/i15/101058.htm
- DOI: https://dx.doi.org/10.3748/wjg.v31.i15.101058


