Copyright
©The Author(s) 2025.
World J Gastroenterol. Apr 7, 2025; 31(13): 105248
Published online Apr 7, 2025. doi: 10.3748/wjg.v31.i13.105248
Published online Apr 7, 2025. doi: 10.3748/wjg.v31.i13.105248
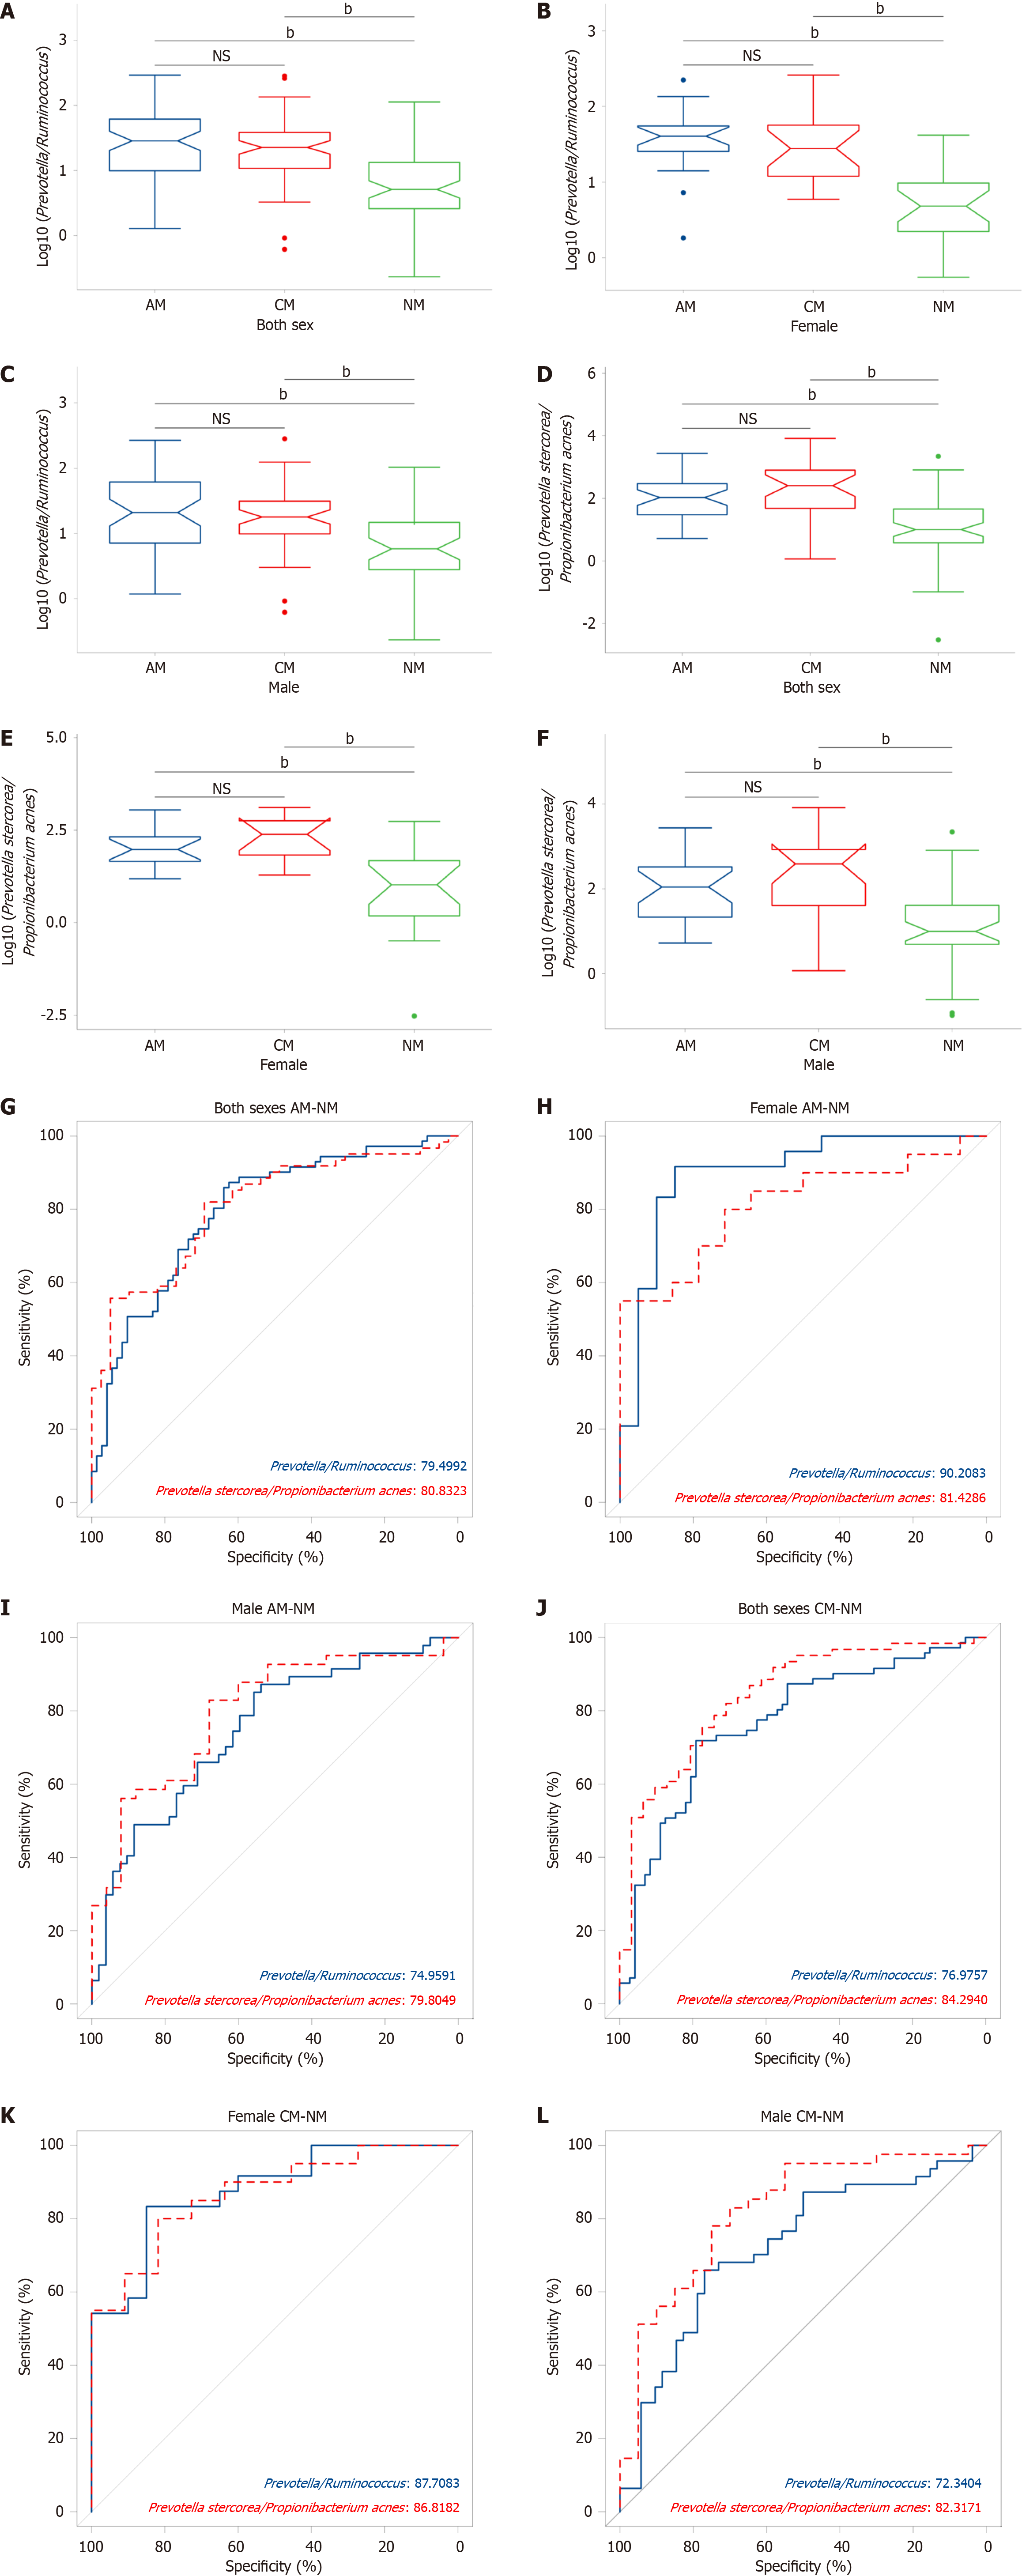
Figure 5 Differences in ratios between rectal cancer patients and healthy controls.
A: Prevotella/Ruminococcus ratio in both sexes; B: Prevotella/Ruminococcus ratio in females; C: Prevotella/Ruminococcus ratio in males; D: Prevotella stercorea (P. stercorea)/Propionibacterium acnes (P. acnes) ratio in both sexes; E: P. stercorea/P. acnes ratio in females; F: P. stercorea/P. acnes ratio in males; G: Receiver operating curve (ROC) curves of two ratios in both sexes between the adjacent noncancerous mucosa (AM) and normal control mucosa (NM); H: ROC curves of two ratios in females between the AM and NM; I: ROC curves of two ratios in males between the AM and NM; J: ROC curves of two ratios in both sexes between the rectal cancer mucosa (CM) and NM; K: ROC curves of two ratios in females between the CM and NM; L: ROC curves of two ratios in males between the CM and NM. bP < 0.01. AM: Adjacent noncancerous mucosa; CM: Rectal cancer mucosa; NM: Normal control mucosa; NS: Not significant.
- Citation: Zhang H, Zhou Y, Jiang YH, Hu WP, Huang LL, Lin HX, Zuo ZG, Du JM, Lou YL. Altered microbiota of rectal mucosa in rectal cancer patients. World J Gastroenterol 2025; 31(13): 105248
- URL: https://www.wjgnet.com/1007-9327/full/v31/i13/105248.htm
- DOI: https://dx.doi.org/10.3748/wjg.v31.i13.105248


