Copyright
©The Author(s) 2025.
World J Gastroenterol. Apr 7, 2025; 31(13): 104697
Published online Apr 7, 2025. doi: 10.3748/wjg.v31.i13.104697
Published online Apr 7, 2025. doi: 10.3748/wjg.v31.i13.104697
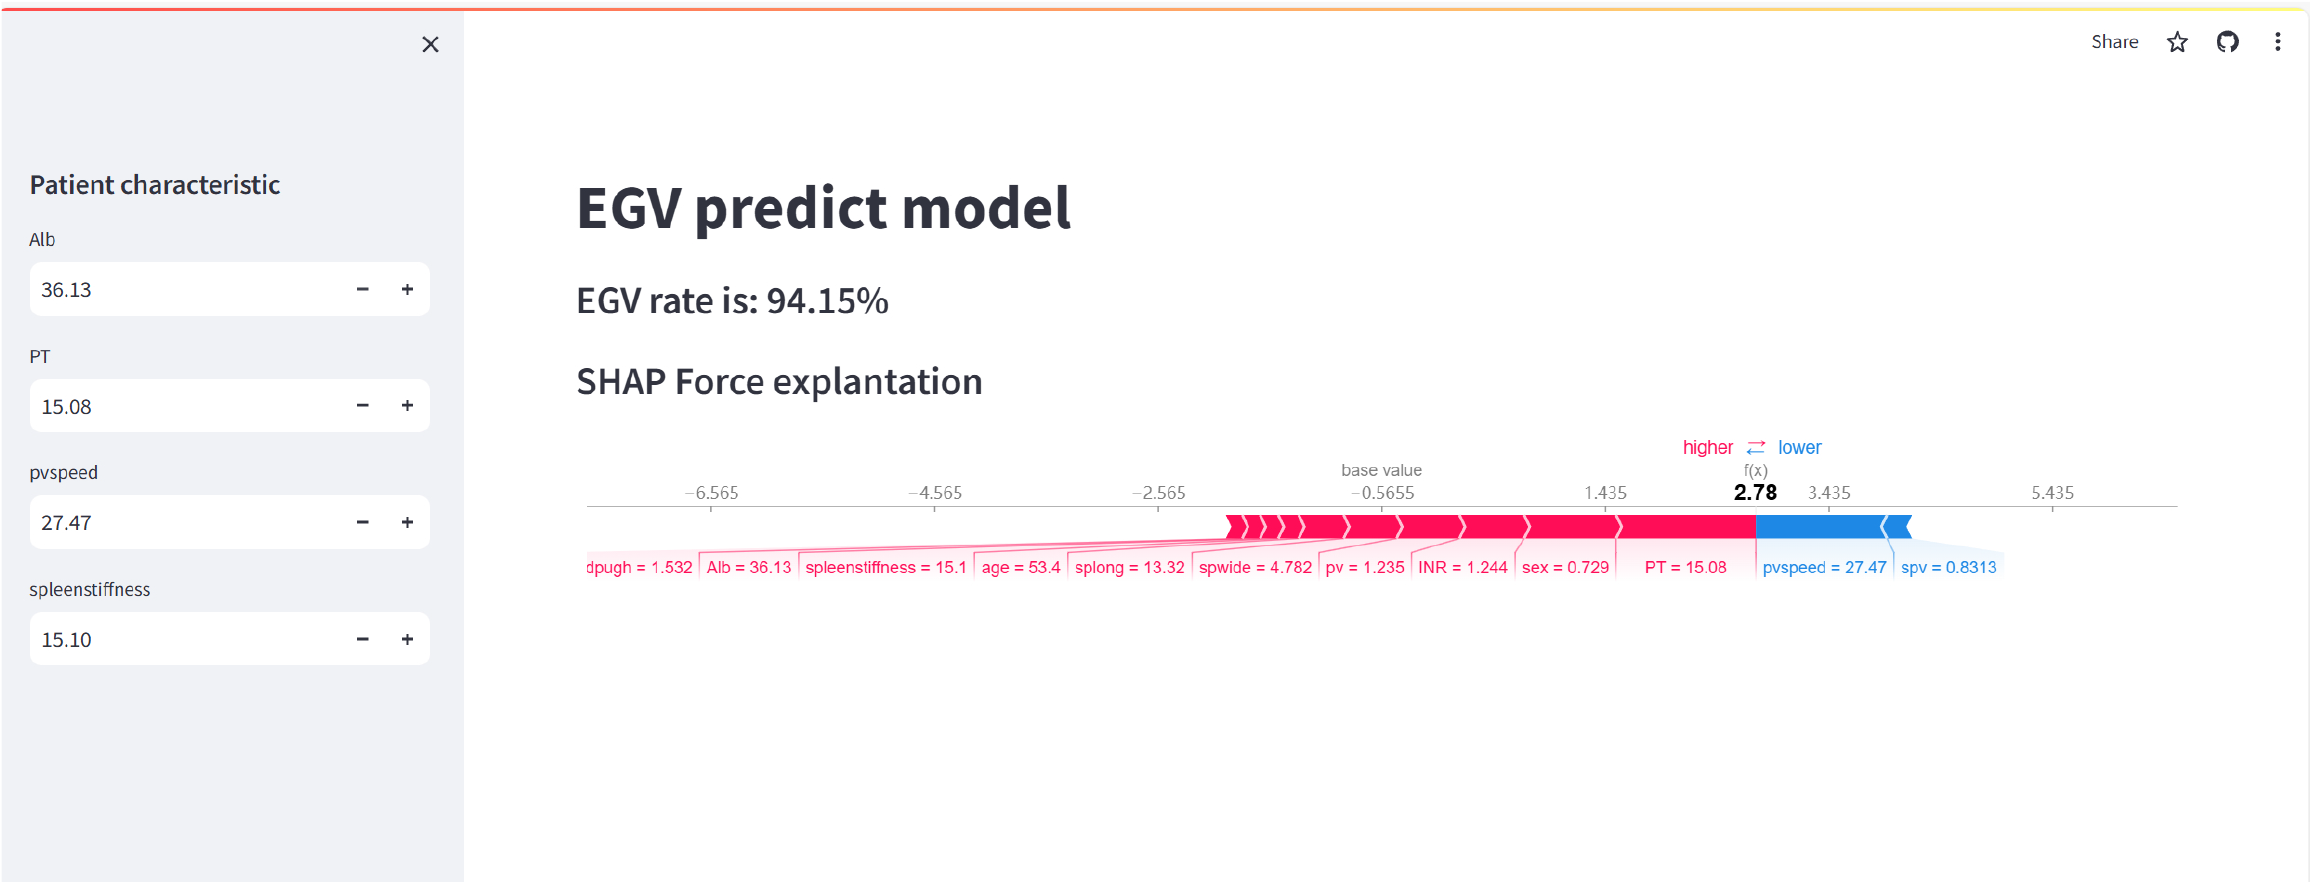
Figure 9 Web-based predictive model.
The image displays a web-based application for predicting esophagogastric varices (EGVs) using the extreme gradient boosting model. The left side of the interface allowed users to input patient characteristics, such as albumin, prothrombin time, portal vein speed and spleen stiffness. These input fields could be adjusted to reflect the specific values for each patient. The main part of the interface shows the prediction of the model, with the EGV risk rate given as 94.15%. Below this, the SHapley Additive exPlanation force plot provides an explanation of the prediction. The force plot visually represents the contribution of each feature to the final predictive score. Features such as spleen stiffness, prothrombin time and portal vein speed are highlighted, showing how they made the prediction higher or lower. The pink bars indicate features that increased the predictive score (higher risk), while blue bars indicate features that decreased it (lower risk). This tool helps clinicians understand the risk factors contributing to EGVs for individual patients by providing a clear and interactive explanation of the predictions of the model. The SHapley Additive exPlanation force plot ensures transparency in the decision-making process, making it easier for healthcare providers to trust and act on the predictions. EGV: Esophagogastric varices; Alb: Albumin; PT: Prothrombin time; pvspeed: Portal vein speed; spwide: Spleen width; pv: Portal vein; spv: Splenic vein; splong: Spleen length; INR: International normalized ratio.
- Citation: Feng SY, Ding ZR, Cheng J, Tu HB. Noninvasive prediction of esophagogastric varices in hepatitis B: An extreme gradient boosting model based on ultrasound and serology. World J Gastroenterol 2025; 31(13): 104697
- URL: https://www.wjgnet.com/1007-9327/full/v31/i13/104697.htm
- DOI: https://dx.doi.org/10.3748/wjg.v31.i13.104697


