Copyright
©The Author(s) 2025.
World J Gastroenterol. Apr 7, 2025; 31(13): 104697
Published online Apr 7, 2025. doi: 10.3748/wjg.v31.i13.104697
Published online Apr 7, 2025. doi: 10.3748/wjg.v31.i13.104697
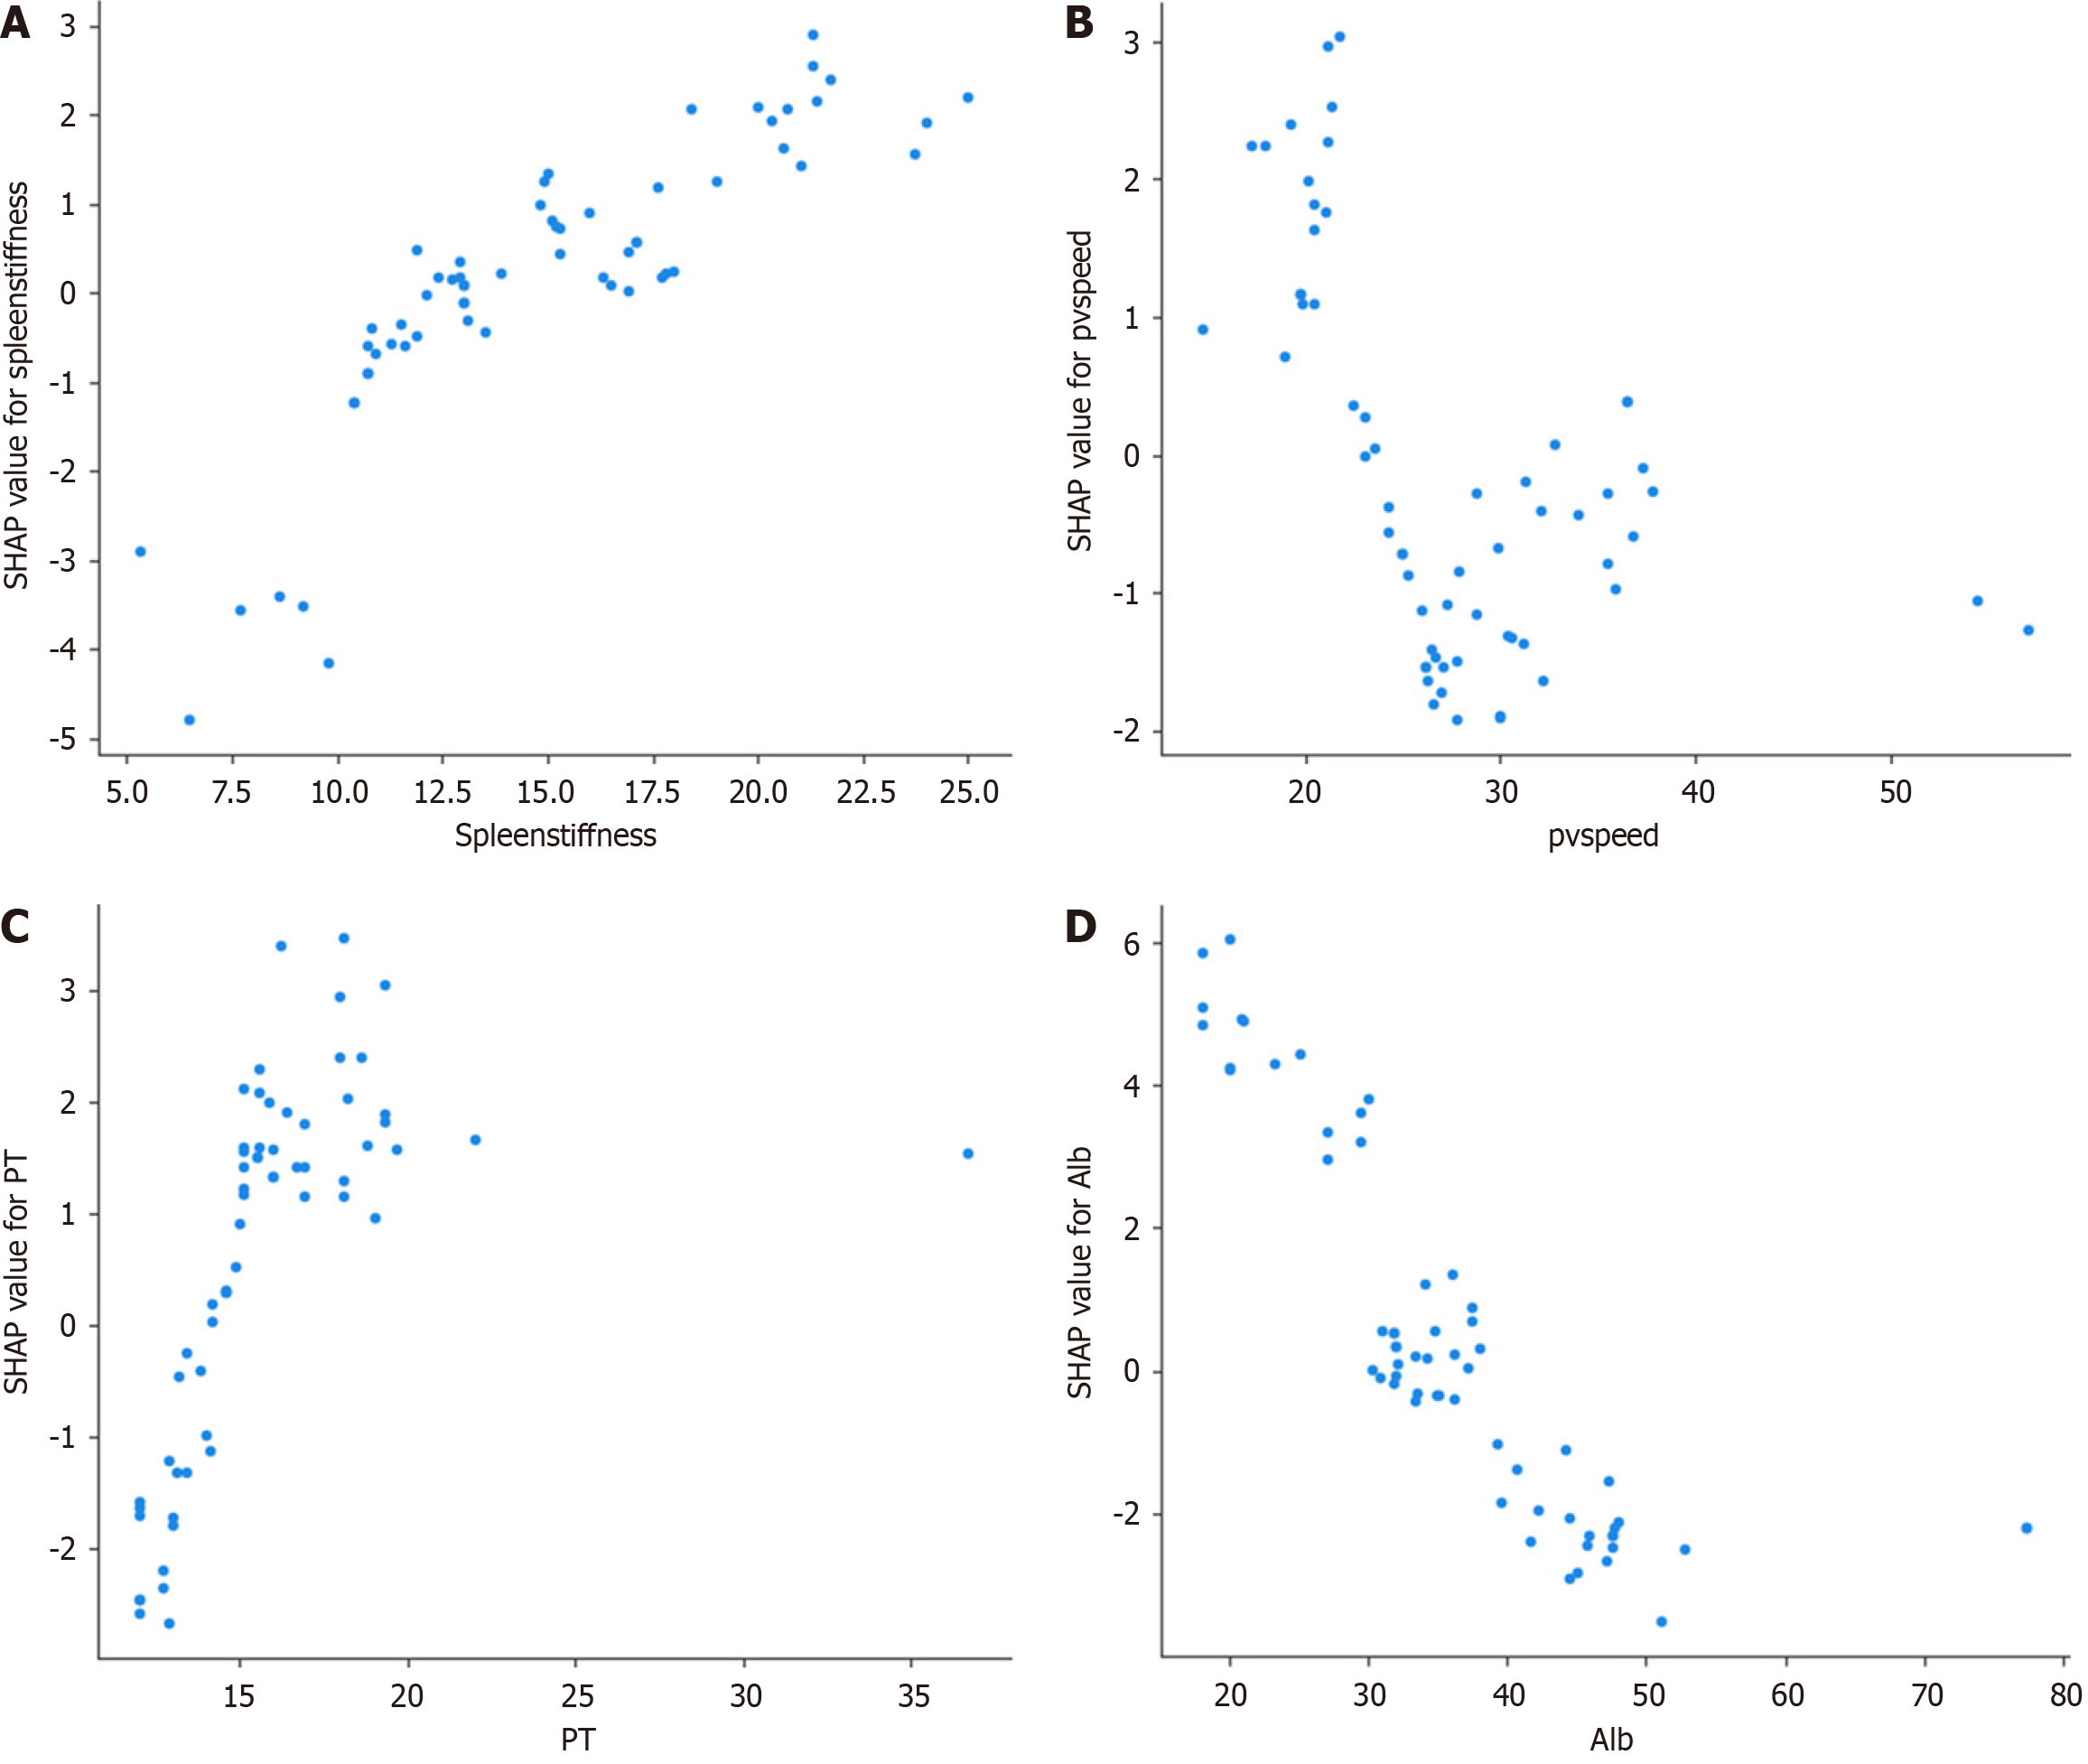
Figure 8 SHapley Additive exPlanation dependency plots for key predictive features.
This figure illustrates the SHapley Additive exPlanation (SHAP) dependency plots for key predictive features, showing how each feature influenced the predictions of the model for esophagogastric varices (EGVs). A: Relationship between spleen stiffness and its SHAP value, revealing a positive correlation where higher spleen stiffness increased the predictive score for EGVs; B: Relationship between portal vein speed and its SHAP value, indicating a negative correlation, with higher speed decreasing the predictive score; C: Relationship between prothrombin time and its SHAP value, where higher PT values were associated with higher SHAP values, suggesting an increased predictive score for EGV; D: Relationship between albumin levels and their SHAP values, showing a negative correlation where higher albumin levels decrease the predictive score. These SHAP dependency plots provide a comprehensive visualization of how individual features affected the predictions of the extreme gradient boosting model, highlighting the most influential factors in predicting high-risk EGVs and aiding in understanding the decision-making process of the model. pvspeed: Portal vein speed; PT: Prothrombin time; Alb: Albumin.
- Citation: Feng SY, Ding ZR, Cheng J, Tu HB. Noninvasive prediction of esophagogastric varices in hepatitis B: An extreme gradient boosting model based on ultrasound and serology. World J Gastroenterol 2025; 31(13): 104697
- URL: https://www.wjgnet.com/1007-9327/full/v31/i13/104697.htm
- DOI: https://dx.doi.org/10.3748/wjg.v31.i13.104697


