Copyright
©The Author(s) 2025.
World J Gastroenterol. Apr 7, 2025; 31(13): 104697
Published online Apr 7, 2025. doi: 10.3748/wjg.v31.i13.104697
Published online Apr 7, 2025. doi: 10.3748/wjg.v31.i13.104697
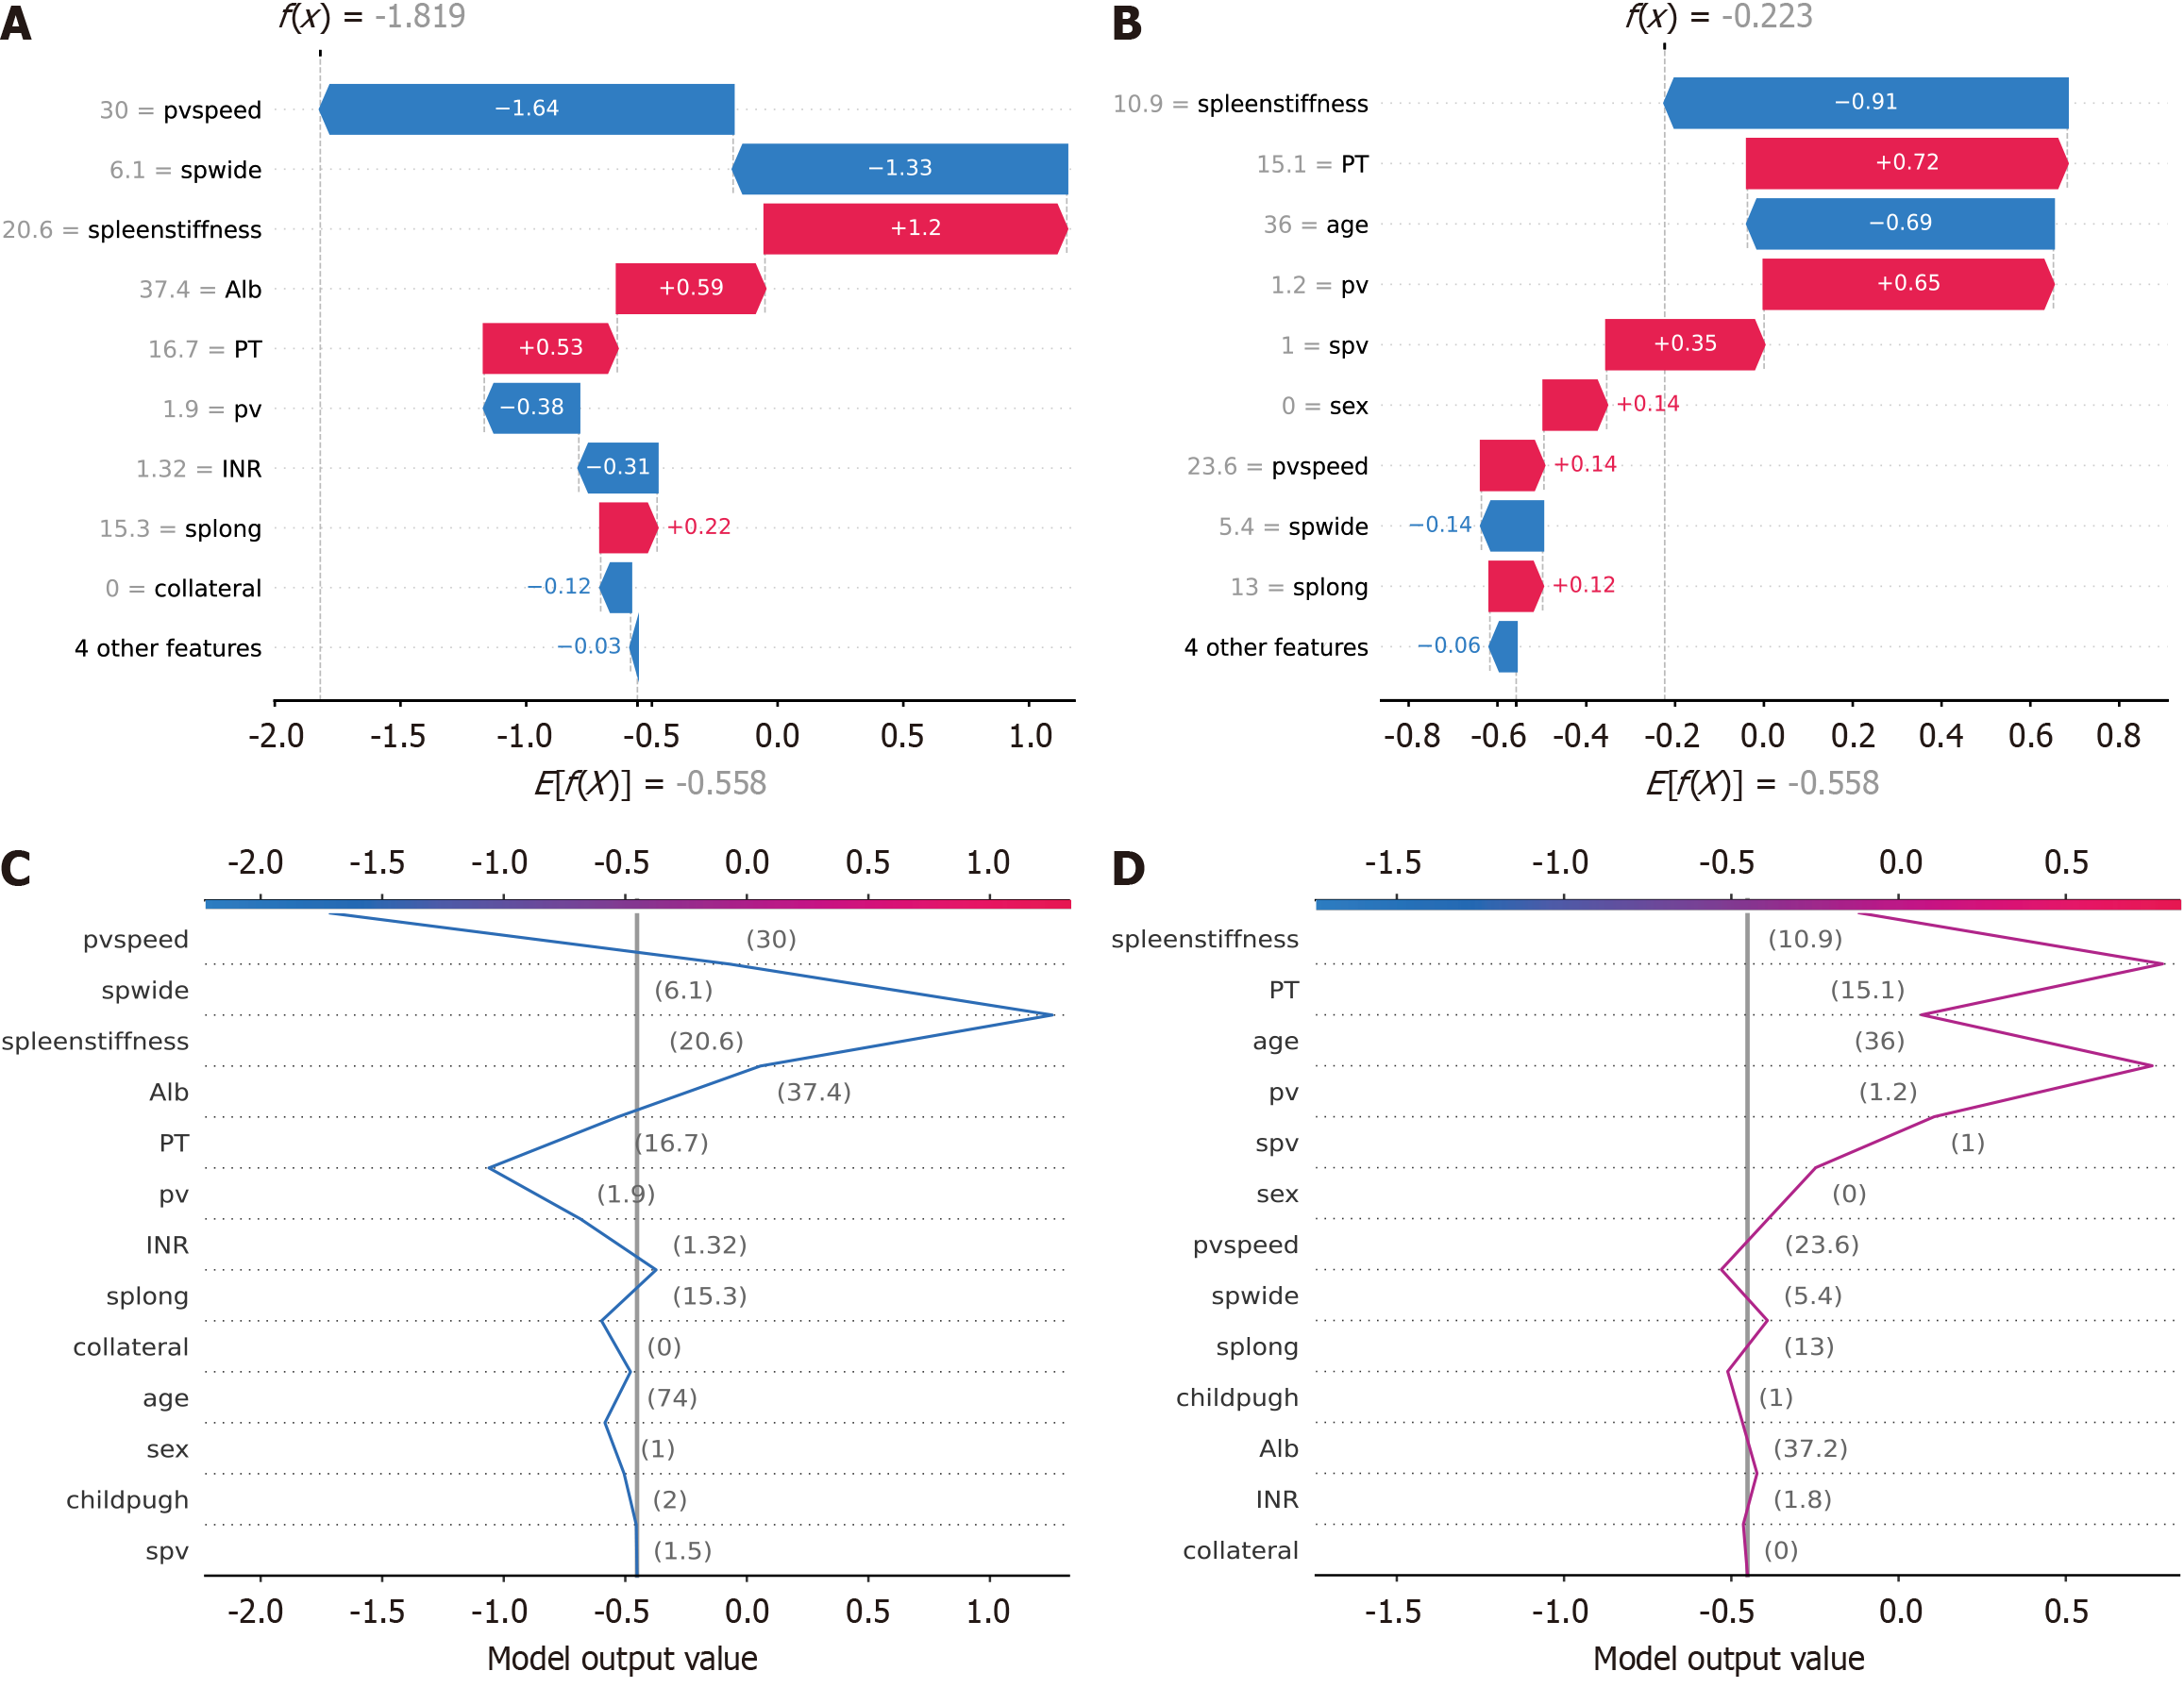
Figure 6 Waterfall and decision plots demonstrating model predictions for actual patients.
A: Waterfall plot for accurately predicted patients shows the contribution of each feature to the final prediction. Features such as portal vein speed, spleen width and spleen stiffness were key contributors. Blue bars decrease the predictive score (indicating lower risk), and red bars increase the predictive score (indicating higher risk). This plot demonstrates how the model effectively used these features to make correct predictions; B: Waterfall plot for inaccurately predicted patients displays the contributions for cases where the predictions of the model were incorrect. The same features were considered, but their combined contributions led to an incorrect prediction. This plot helped identify which features might have been misinterpreted by the model; C: Decision plot for accurately predicted patients shows how the predictive score of the model changed as each feature was considered. The cumulative impact of features such as portal vein speed, spleen width and spleen stiffness led to a correct prediction. Each point on the line represents the contribution of an additional feature to the final score; D: Decision plot for inaccurately predicted patients illustrates the cumulative effect of each feature for patients with incorrect predictions. Despite the inclusion of significant features, the cumulative contributions did not lead to an accurate prediction. This helped identify potential areas for model improvement. spwide: Spleen width; PT: Prothrombin time; pv: Portal vein; spv: Splenic vein; splong: Spleen length; Alb: Albumin; pvspeed: Portal vein speed; INR: International normalized ratio.
- Citation: Feng SY, Ding ZR, Cheng J, Tu HB. Noninvasive prediction of esophagogastric varices in hepatitis B: An extreme gradient boosting model based on ultrasound and serology. World J Gastroenterol 2025; 31(13): 104697
- URL: https://www.wjgnet.com/1007-9327/full/v31/i13/104697.htm
- DOI: https://dx.doi.org/10.3748/wjg.v31.i13.104697


