Copyright
©The Author(s) 2025.
World J Gastroenterol. Apr 7, 2025; 31(13): 104697
Published online Apr 7, 2025. doi: 10.3748/wjg.v31.i13.104697
Published online Apr 7, 2025. doi: 10.3748/wjg.v31.i13.104697
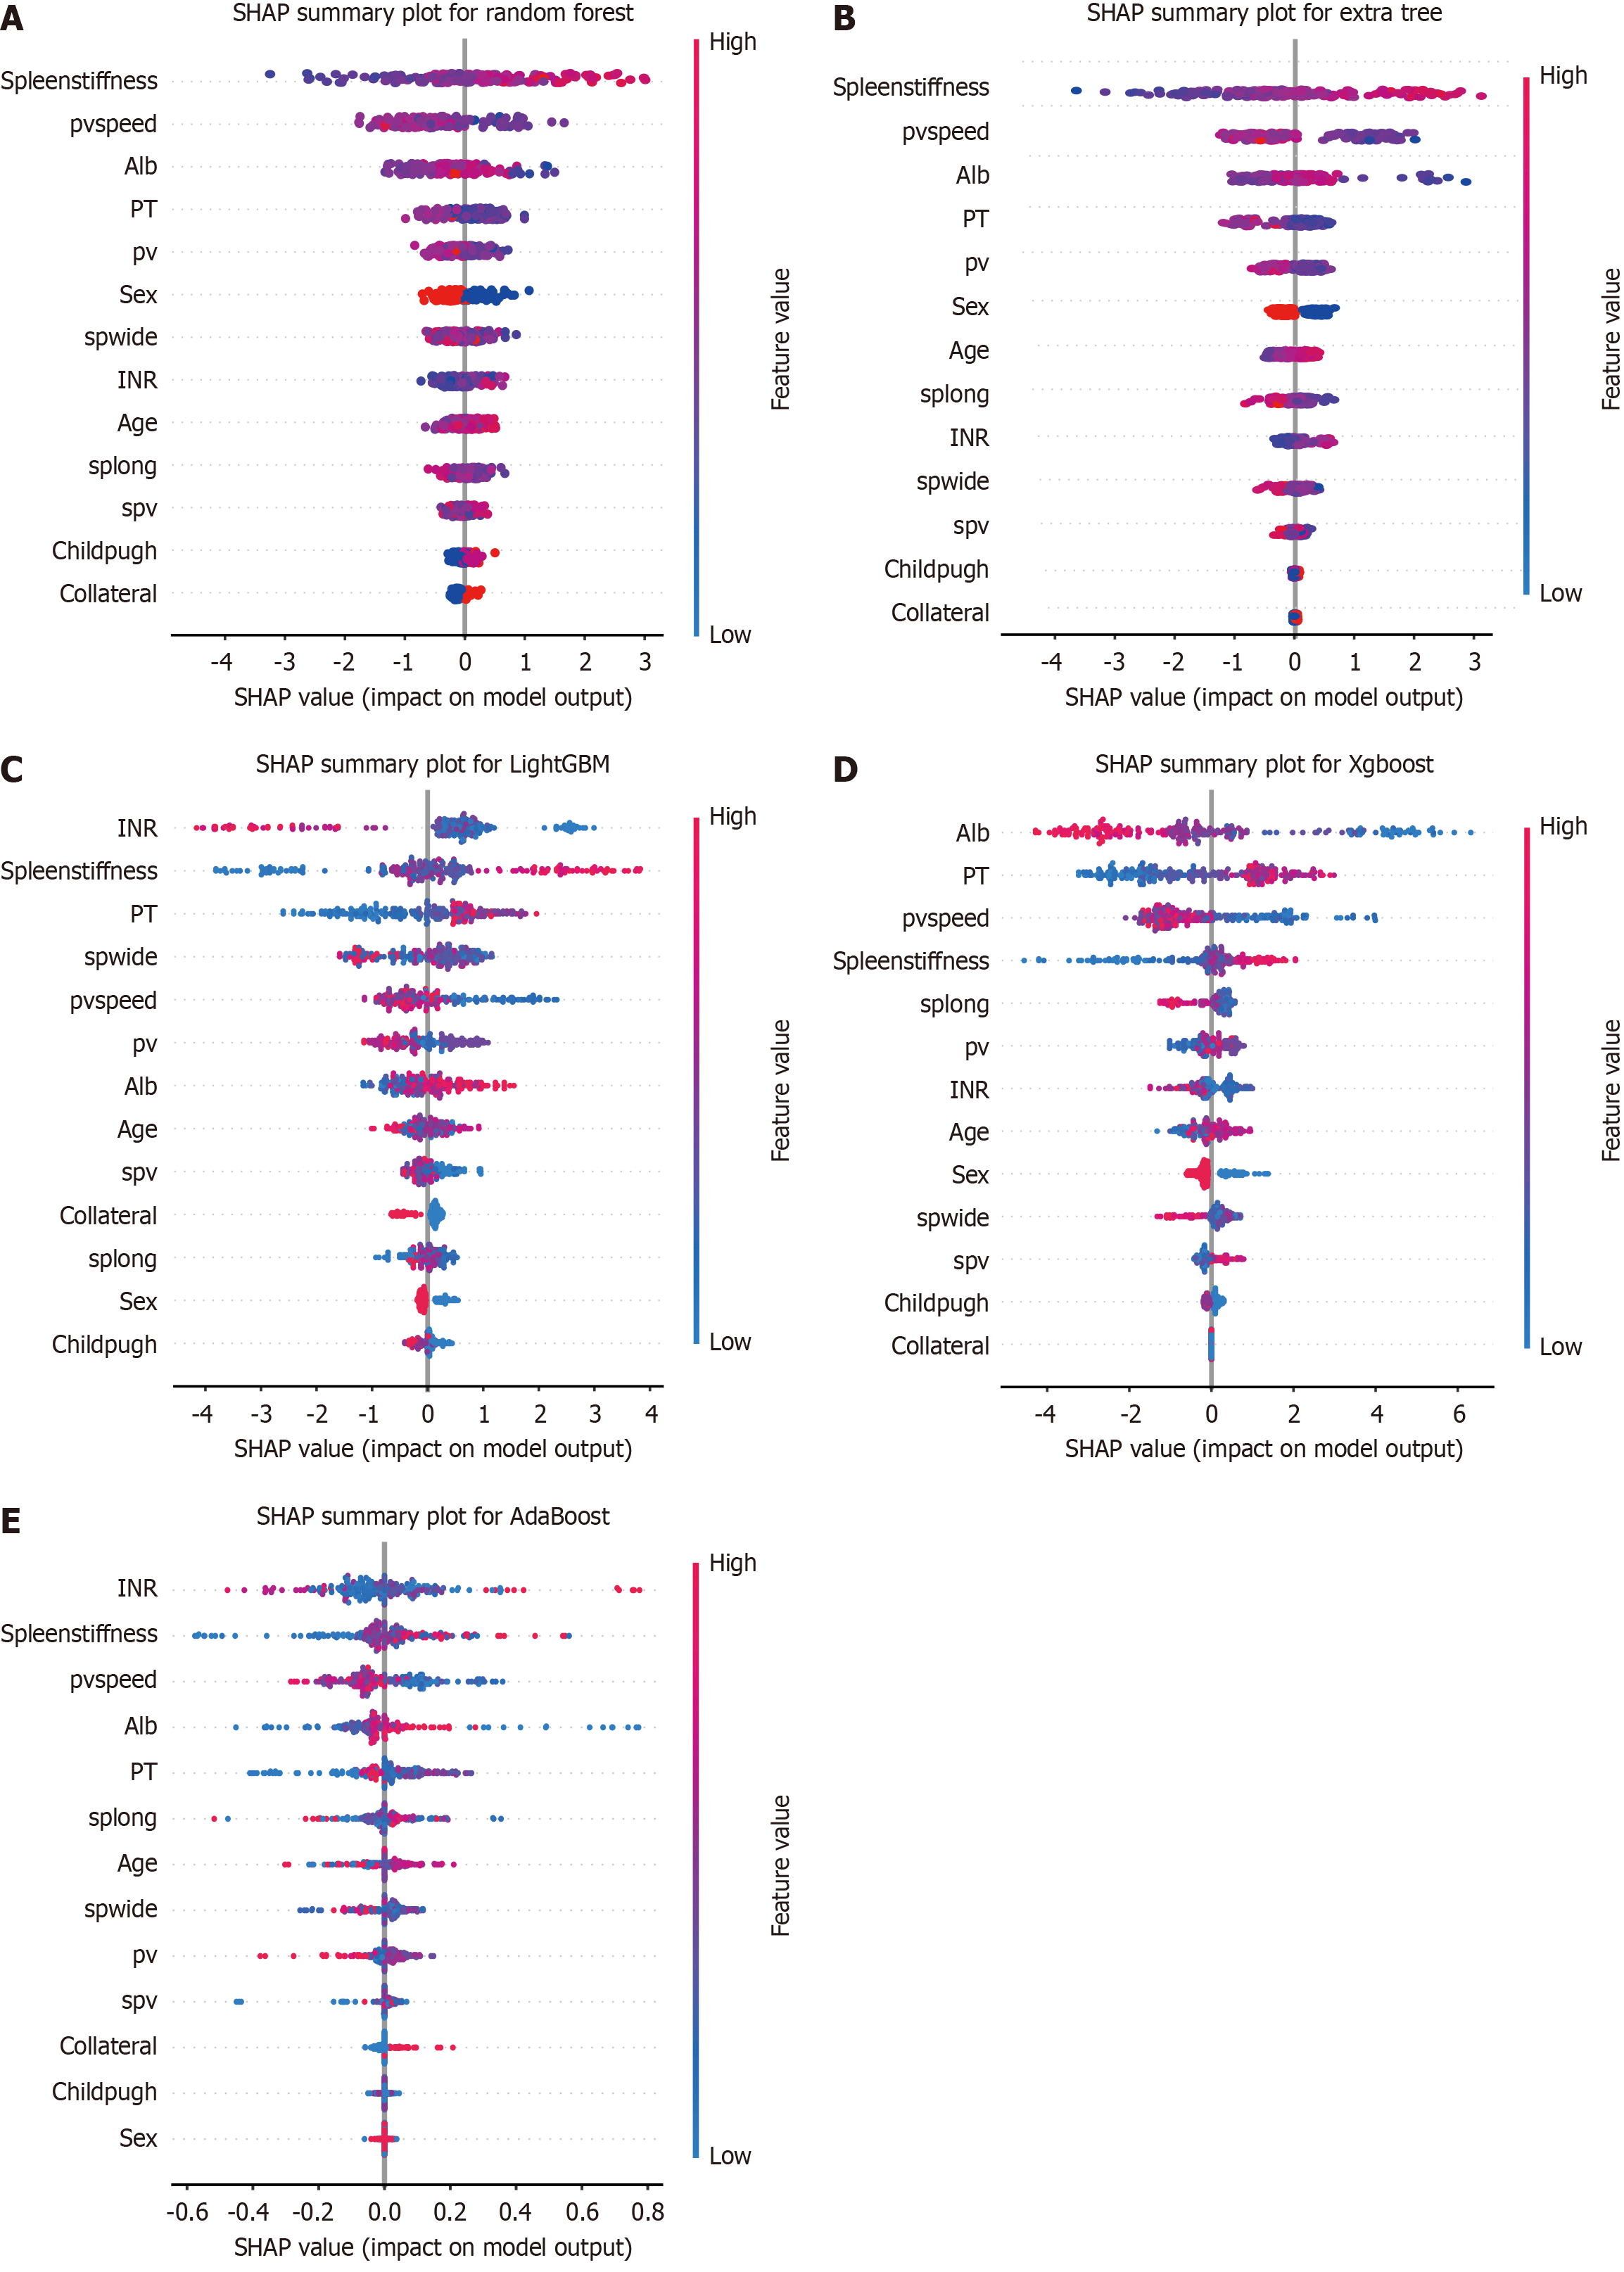
Figure 4 Overall bee swarm plot for the top five models ranked by area under curve value.
A: Random forest; B: Extra tree; C: Light gradient boosting machine; D: Extreme gradient boost; E: Adaptive boosting. SHAP: SHapley Additive exPlanation; pvspeed: Portal vein speed; Alb: Albumin; PT: Prothrombin time; pv: Portal vein; spwide: Spleen width; INR: International normalized ratio; splong: Spleen length.
- Citation: Feng SY, Ding ZR, Cheng J, Tu HB. Noninvasive prediction of esophagogastric varices in hepatitis B: An extreme gradient boosting model based on ultrasound and serology. World J Gastroenterol 2025; 31(13): 104697
- URL: https://www.wjgnet.com/1007-9327/full/v31/i13/104697.htm
- DOI: https://dx.doi.org/10.3748/wjg.v31.i13.104697


