Copyright
©The Author(s) 2025.
World J Gastroenterol. Apr 7, 2025; 31(13): 104697
Published online Apr 7, 2025. doi: 10.3748/wjg.v31.i13.104697
Published online Apr 7, 2025. doi: 10.3748/wjg.v31.i13.104697
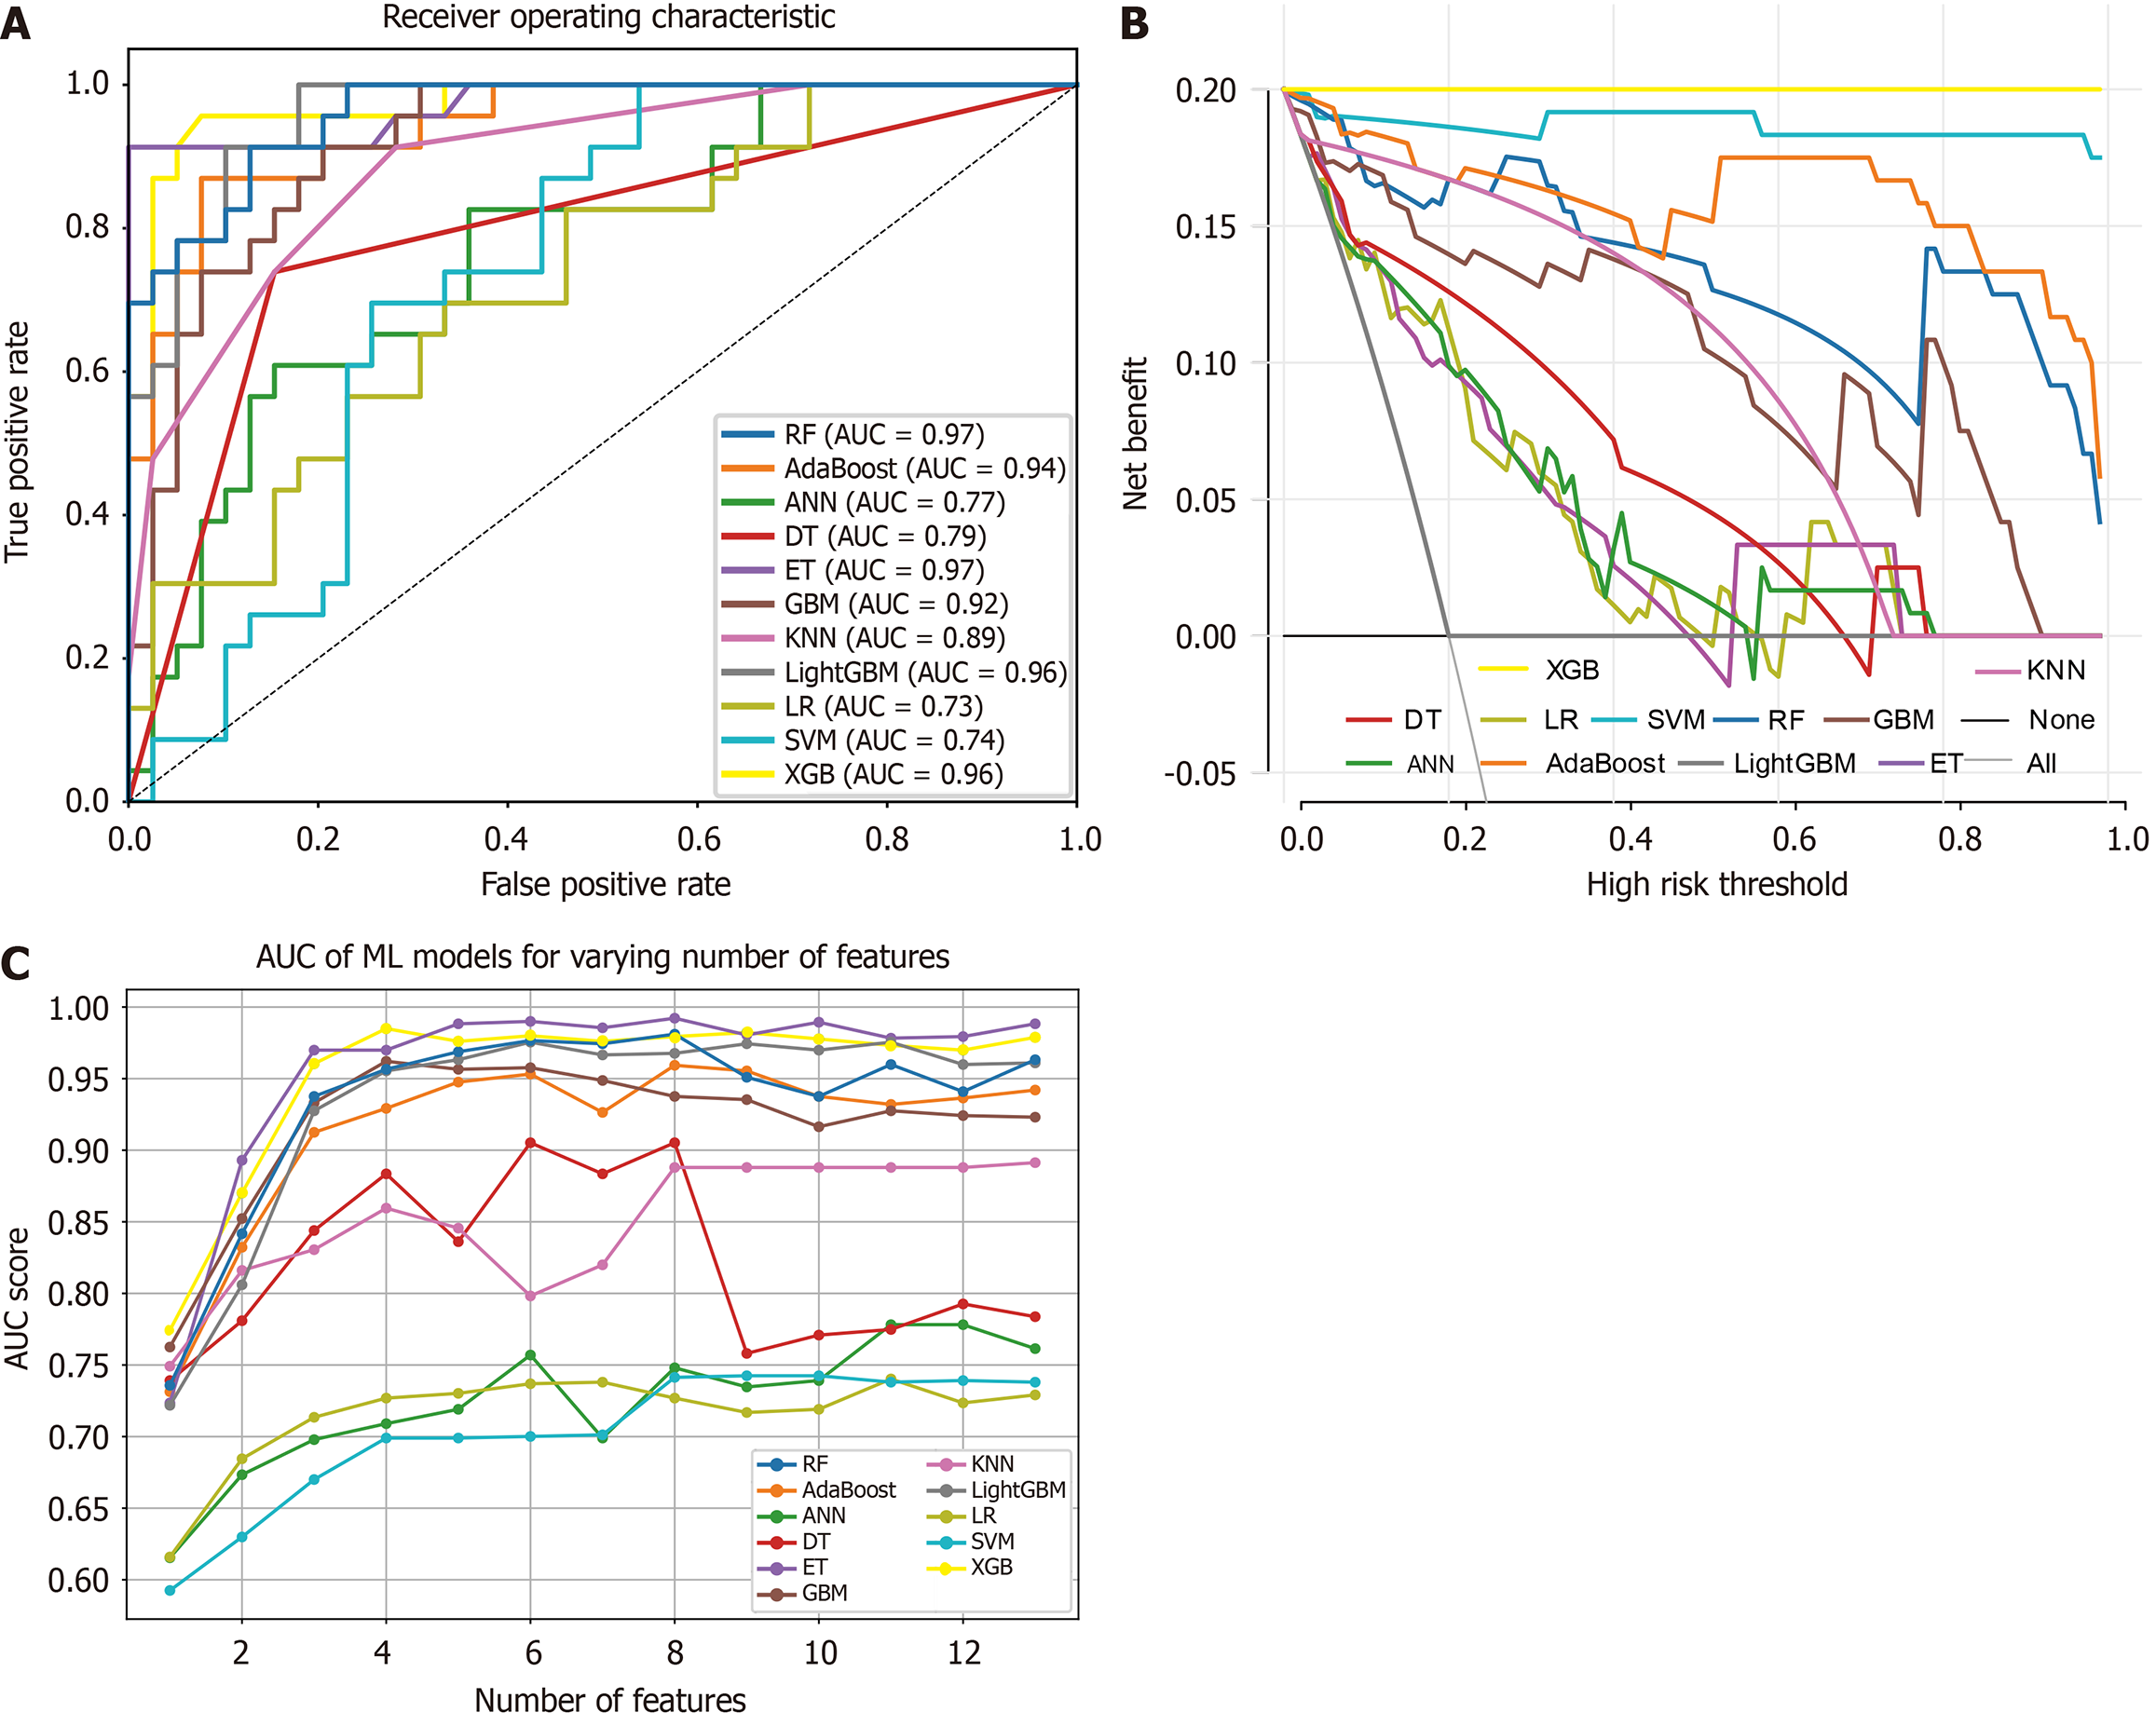
Figure 3 Curves for various prediction metrics across all models.
A: Receiver operating characteristic curves; B: Decision curve analysis curves; C: Area under the curve values corresponding to different numbers of features. AUC: Area under the curve; RF: Random forest; AdaBoost: Adaptive boosting; ANN: Artificial neural network; DT: Decision tree; ET: Extra trees; GBM: Gradient boosting machine; KNN: K-nearest neighbors; LightGBM: Light gradient boosting machine; LR: Logistic regression; SVM: Support vector machine; XGB: Extreme gradient boosting.
- Citation: Feng SY, Ding ZR, Cheng J, Tu HB. Noninvasive prediction of esophagogastric varices in hepatitis B: An extreme gradient boosting model based on ultrasound and serology. World J Gastroenterol 2025; 31(13): 104697
- URL: https://www.wjgnet.com/1007-9327/full/v31/i13/104697.htm
- DOI: https://dx.doi.org/10.3748/wjg.v31.i13.104697


